
- Submit a Protocol
- Receive Our Alerts
- EN

- Protocols

- Articles and Issues
- For Authors
- About
- Become a Reviewer

Analysis of N-acetylmuramic acid-6-phosphate (MurNAc-6P) Accumulation by HPLC-MS
Published: Vol 7, Iss 15, Aug 5, 2017 DOI: 10.21769/BioProtoc.2420 Views: 8172
Reviewed by: Masahiro MoritaKanika GeraAnonymous reviewer(s)
Original research article
The authors used this protocol in:
Oct 2016

Protocol Collections
Comprehensive collections of detailed, peer-reviewed protocols focusing on specific topics

Related protocols
Abstract
We describe here in detail a high-performance liquid chromatography-mass spectrometry (HPLC-MS)-based method to determine N-acetylmuramic acid-6-phosphate (MurNAc-6P) in bacterial cell extracts. The method can be applied to both Gram-negative and Gram-positive bacteria, and as an example we use Escherichia coli cells in this study. Wild type and mutant cells are grown for a defined time in a medium of choice and harvested by centrifugation. Then the cells are disintegrated and soluble cell extracts are generated. After removal of proteins by precipitation with acetone, the extracts are analyzed by HPLC-MS. Base peak chromatograms of wild type and mutant cell extracts are used to determine a differential ion spectrum that reveals differences in the MurNAc-6P content of the two samples. Determination of peak areas of extracted chromatograms of MurNAc-6P ((M-H)- = 372.070 m/z in negative ion mode) allows quantifying MurNAc-6P levels, that are used to calculate recycling rates of the MurNAc-content of peptidoglycan.
Keywords: BacteriaBackground
Large parts of the peptidoglycan cell wall of bacteria are steadily turned over and possibly recovered (recycled) during bacterial growth. A key compound of the peptidoglycan recycling metabolism is N-acetylmuramic acid-6-phosphate (MurNAc-6P), which accumulates in a MurNAc-6P etherase (MurQ) mutant of Escherichia coli (Jaeger et al., 2005; Uehara et al., 2006). MurQ orthologs are found in many bacteria, including Gram-positive bacteria (Litzinger et al., 2010; Reith and Mayer, 2011). MurNAc-6P accumulation in murQ mutants recently proved recycling of the MurNAc-content of the bacterial cell wall in Gram-positive bacteria and was used to quantify intracellular MurNAc-6P levels, which allowed determining peptidoglycan recycling rates (Borisova et al., 2016).
Materials and Reagents
- 50 ml tubes (SARSTEDT, catalog number: 62.547.254 )
- Micro-tubes 2 ml (SARSTEDT, catalog number: 72.691 )
- Micro-tubes 2 ml with cap (SARSTEDT, catalog number: 72.694 )
- Glass beads (0.25 to 0.5 mm) (Carl Roth, catalog number: A553.1 )
- Escherichia coli strains: MC4100 (wild type) and TJ2e (∆murQ) (Jaeger et al., 2005)
- Acetone (CH3COCH3) (Sigma-Aldrich, catalog number: 34850-2.5L )
- Ammonium formate (NH4HCOO) (VWR, catalog number: 17843-50G )
- Acetonitrile (CH3CN) (Avantor Performance Materials, J.T. Baker®, catalog number: 9012-03 )
- Millipore ultrapure water (autoclaved)
- BactoTM yeast extract (BD, BactoTM, catalog number: 212720 )
- BactoTM tryptone (BD, BactoTM, catalog number: 211699 )
- Sodium chloride (NaCl) (Sigma-Aldrich, catalog number: 31434-5KG-R )
- Propan-2-ol (Sigma-Aldrich, catalog number: 34863-2.5L-M )
- Formic acid (HCOOH) (VWR, catalog number: 56302-50ML )
- Sodium hydroxide (NaOH), 1 N (VWR, catalog number: 31627.290 )
- Medium Luria Bertani (LB) broth (see Recipes)
- LC-MS calibrant (10 mM sodium formate) (see Recipes)
- HPLC buffer A (see Recipes)
Equipment
- 1,000 ml Erlenmeyer flasks with chicane
- 100 ml Erlenmeyer flasks with chicane
- Shaker (set at 160 rpm) (Eppendorf, New BrunswichTM, model: Excella® E10 )
- Pipette controller (BrandTech Scientific, model: accu-jet® pro )
- Microcentrifuge (Thermo Fischer Scientific, Thermo ScientificTM, model: HeraeusTM PicoTM 17 )
- Medium bench centrifuge (Thermo Fischer Scientific, model: HeraeusTM Biofuge Pico )
- Cell density meter (Biochrom, model: Biochrom WPA CO8000 )
- Cell disrupter (GMI, model: Thermo Savant FastPrep 120 )
- Rotational vacuum concentrator (Martin Christ Gefriertrocknungsanlagen, model: RVC 2-18 CDplus )
- Gemini® 5 µm 110Å, 150 x 4.6 mm LC column (Phenomenex, catalog number: 00F-4435-E0 )
- Mass spectrometer (Bruker, model: micrOTOF focus II )
- High-performance liquid chromatography (Thermo Fischer Scientific, Thermo ScientificTM, model: UltimateTM 3000 RS )
Software
- Chromeleon Xpress (Dionex)
- MicroTOF control Version 3.0 (Bruker Daltonics)
- Bruker Compass HyStar Version 3.2 (Bruker Daltonics)
- Compass Data Analysis Version 4.0 (Bruker Daltonics)
- MetaboliteDetect 2.0 (Bruker Daltonics)
- GraphPad Prism 6 (San Diego, CA, USA)
Procedure
- Bacterial growth
- Add 20 ml LB medium to a 100 ml Erlenmeyer flask with chicane.
- Inoculate LB broth media with single colonies of E. coli wild type and ∆murQ grown on agar plates, which were streaked out the day before.
- Grow bacteria for 16 h at 37 °C and 160 rpm.
- Measure OD600 nm of the overnight cultures (expected OD of 3.5 for wild type and ∆murQ).
- Add 200 ml LB medium to 1,000 ml Erlenmeyer flasks.
- Inoculate the 200 ml LB medium with bacteria to obtain an initial OD600 nm of 0.05.
- After 3 h of growth, bacteria are expected to reach an OD600 nm of 1.76.
- Add 20 ml LB medium to a 100 ml Erlenmeyer flask with chicane.
- Generation of bacterial cytosolic fractions
- Spin down 170 ml (a volume corresponding to 100 ml OD 3) of bacterial suspension (4 x 50 ml Falcons) at 3,000 x g for 10 min at room temperature.
- Carefully resuspend bacterial pellets in 20 ml Millipore water. Avoid vortexing of the bacterial suspension to prevent cell lysis.
- Spin down bacteria at 3,000 x g for 10 min at room temperature.
- Discard supernatant and freeze pellets immediately at -80 °C. Samples are further proceeded the next day or within one week of storage at -80 °C.
- Thaw frozen samples at room temperature and resuspend pellets in Millipore water to a final volume of 1.2 ml.
- Add 0.25 g of the glass beads to the Micro-tubes with cups.
- Transfer 1.2 ml bacterial suspension to the micro tubes with glass beads.
- Disintegrate cells with glass beads using a cell disruptor (4x for 35 sec at speed 6). After the second cycle, chill cells down for 1 min on ice.
- Spin down samples in a microcentrifuge at 16,000 x g for 10 min at room temperature.
- Add 200 µl of the supernatant to 800 µl of ice-cold acetone to precipitate remaining proteins in the samples in 2 ml Micro-tubes and invert tubes 3 times.
- Centrifuge samples at 16,000 x g for 10 min at room temperature and transfer supernatant to a new 2 ml Micro-tube.
- Dry cytosolic fractions under vacuum for 2 h at 55 °C and store at 4 °C.
- Dissolve cytosolic fractions in 100 µl Millipore water prior to LC-MS measurements.
- Inject 5 µl of each sample to the LC column, pre-equilibrated with buffer A (0.1% formic acid, 0.05% ammonium formate).
- Spin down 170 ml (a volume corresponding to 100 ml OD 3) of bacterial suspension (4 x 50 ml Falcons) at 3,000 x g for 10 min at room temperature.
- LC-MS program
- Generate with MicrOTOF control an MS program applying a mass range of 80 to 3,000 m/z.
- Calibrate MS in negative ion mode using 10 mM sodium formate calibrant.
- Generate with Bruker Compass HyStar a 45-min-HPLC gradient program:
- Flow rate of 0.2 ml/min.
- Column compartment temperature 37 °C.
- UV trace of 202 nm.
- 5 min 100% buffer A (0.1% formic acid, 0.05% ammonium formate).
- 30 min linear gradient from 100% to 60% buffer A (40% buffer B [100% acetonitrile]).
- 5 min 60% buffer A.
- 5 min 100% buffer A.
- Generate with MicrOTOF control an MS program applying a mass range of 80 to 3,000 m/z.
Data analysis
HPLC-MS data for E. coli wild type (WT) and ∆murQ mutant samples were analyzed with Compass Data Analysis. Data are shown as base peak chromatograms (BPC) in negative ion mode within a mass to charge (m/z) range of 80 to 3,000. A differential ion spectrum (DS) was generated, subtracting the BPC of wild type from the BPC of ∆murQ (Figure 1), using the program Metabolite Detect and a difference factor of 5. The DS revealed major differences in intracellular metabolite levels at a retention time of 19.8 to 22.7 min (Figure 1). The DS at this retention time contains ions in negative ion mode corresponding to MurNAc-6P ((M-H)- = 372.071 m/z), an elimination product of MurNAc-6P (282.039 m/z), and MurNAc-6P dimer (745.148 m/z) (Figure 2). Furthermore, extracted ion chromatograms (EICs) for MurNAc-6P ((M-H)- calculated = 372.070 m/z) were generated using the Compass Data Analysis tool. The area under the curve (AUC) for the EIC of MurNAc-6P was determined using the program Prism 6 with the baseline set to 30 (Figure 3). Analysis of the AUC for the EICs for MurNAc-6P in combination with a standard curve can be used to quantify the amount of MurNAc-6P accumulating in ∆murQ mutants (Borisova et al., 2016).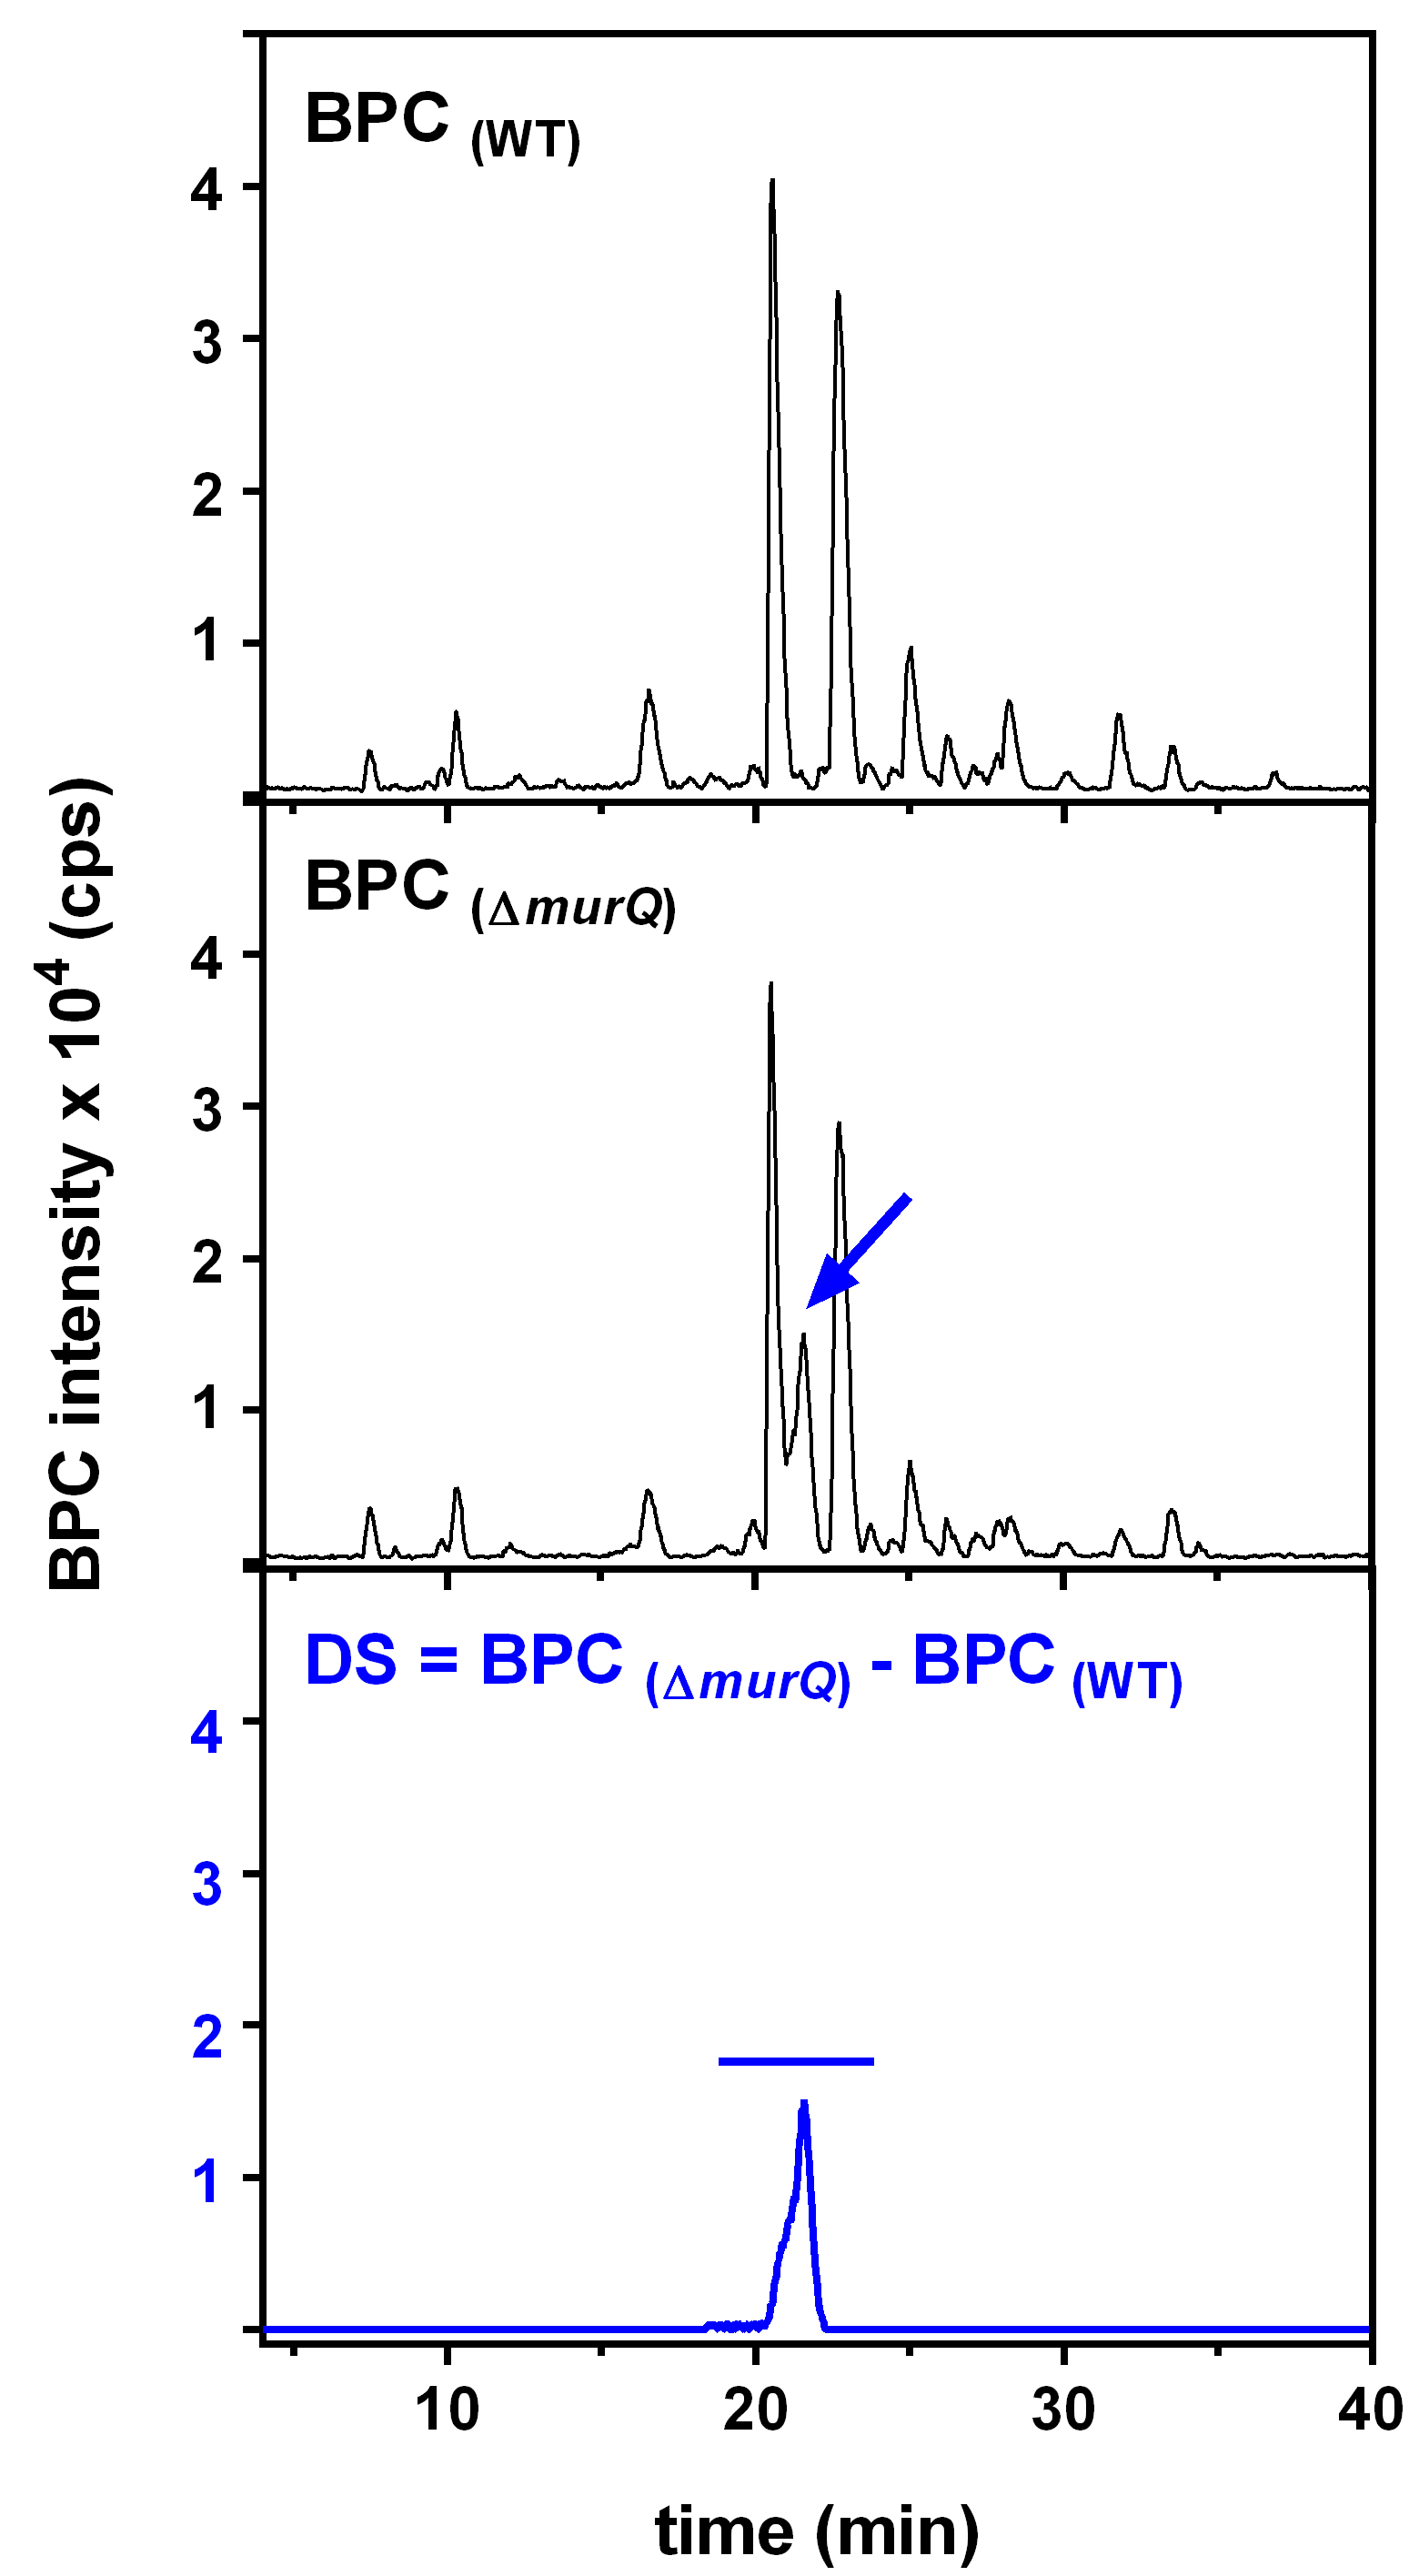
Figure 1. HPLC-MS analyses of soluble extracts of WT and ∆murQ mutant cells. Base peak chromatograms (BPC) show similar metabolite pattern, with differences that can be visualized by calculating a differential ion spectrum (DS).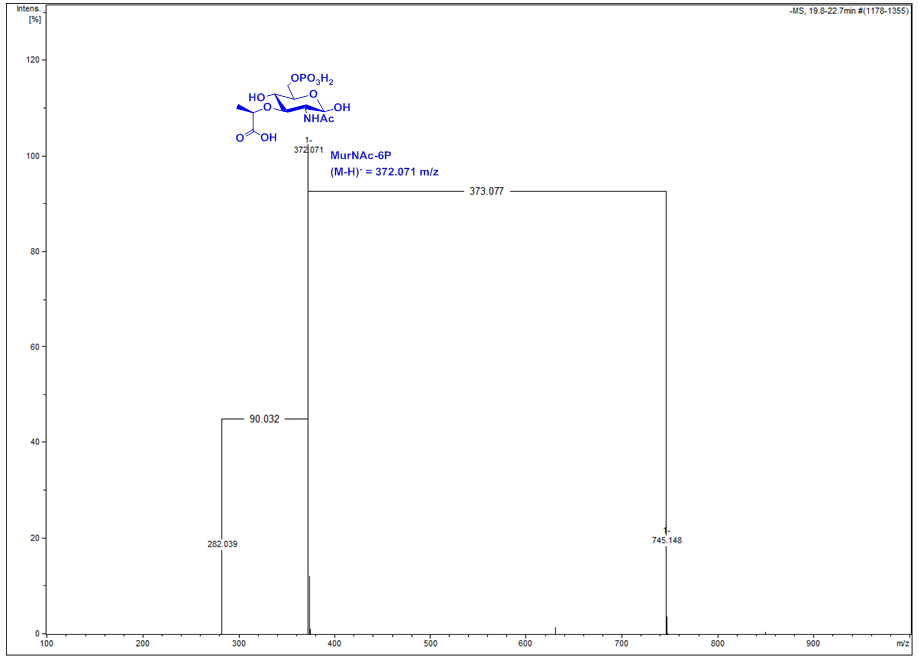
Figure 2. Mass spectrum of the differential ion spectrum (DS) signal at 19.8 to 22.7 min of Figure 1. The compound is identified as MurNAc-6P by its exact mass ((M-H)- observed = 372.071 m/z, theoretical = 372.070 m/z), the exact mass of a dimer (745.148 m/z) and of an elimination product (282.039 m/z).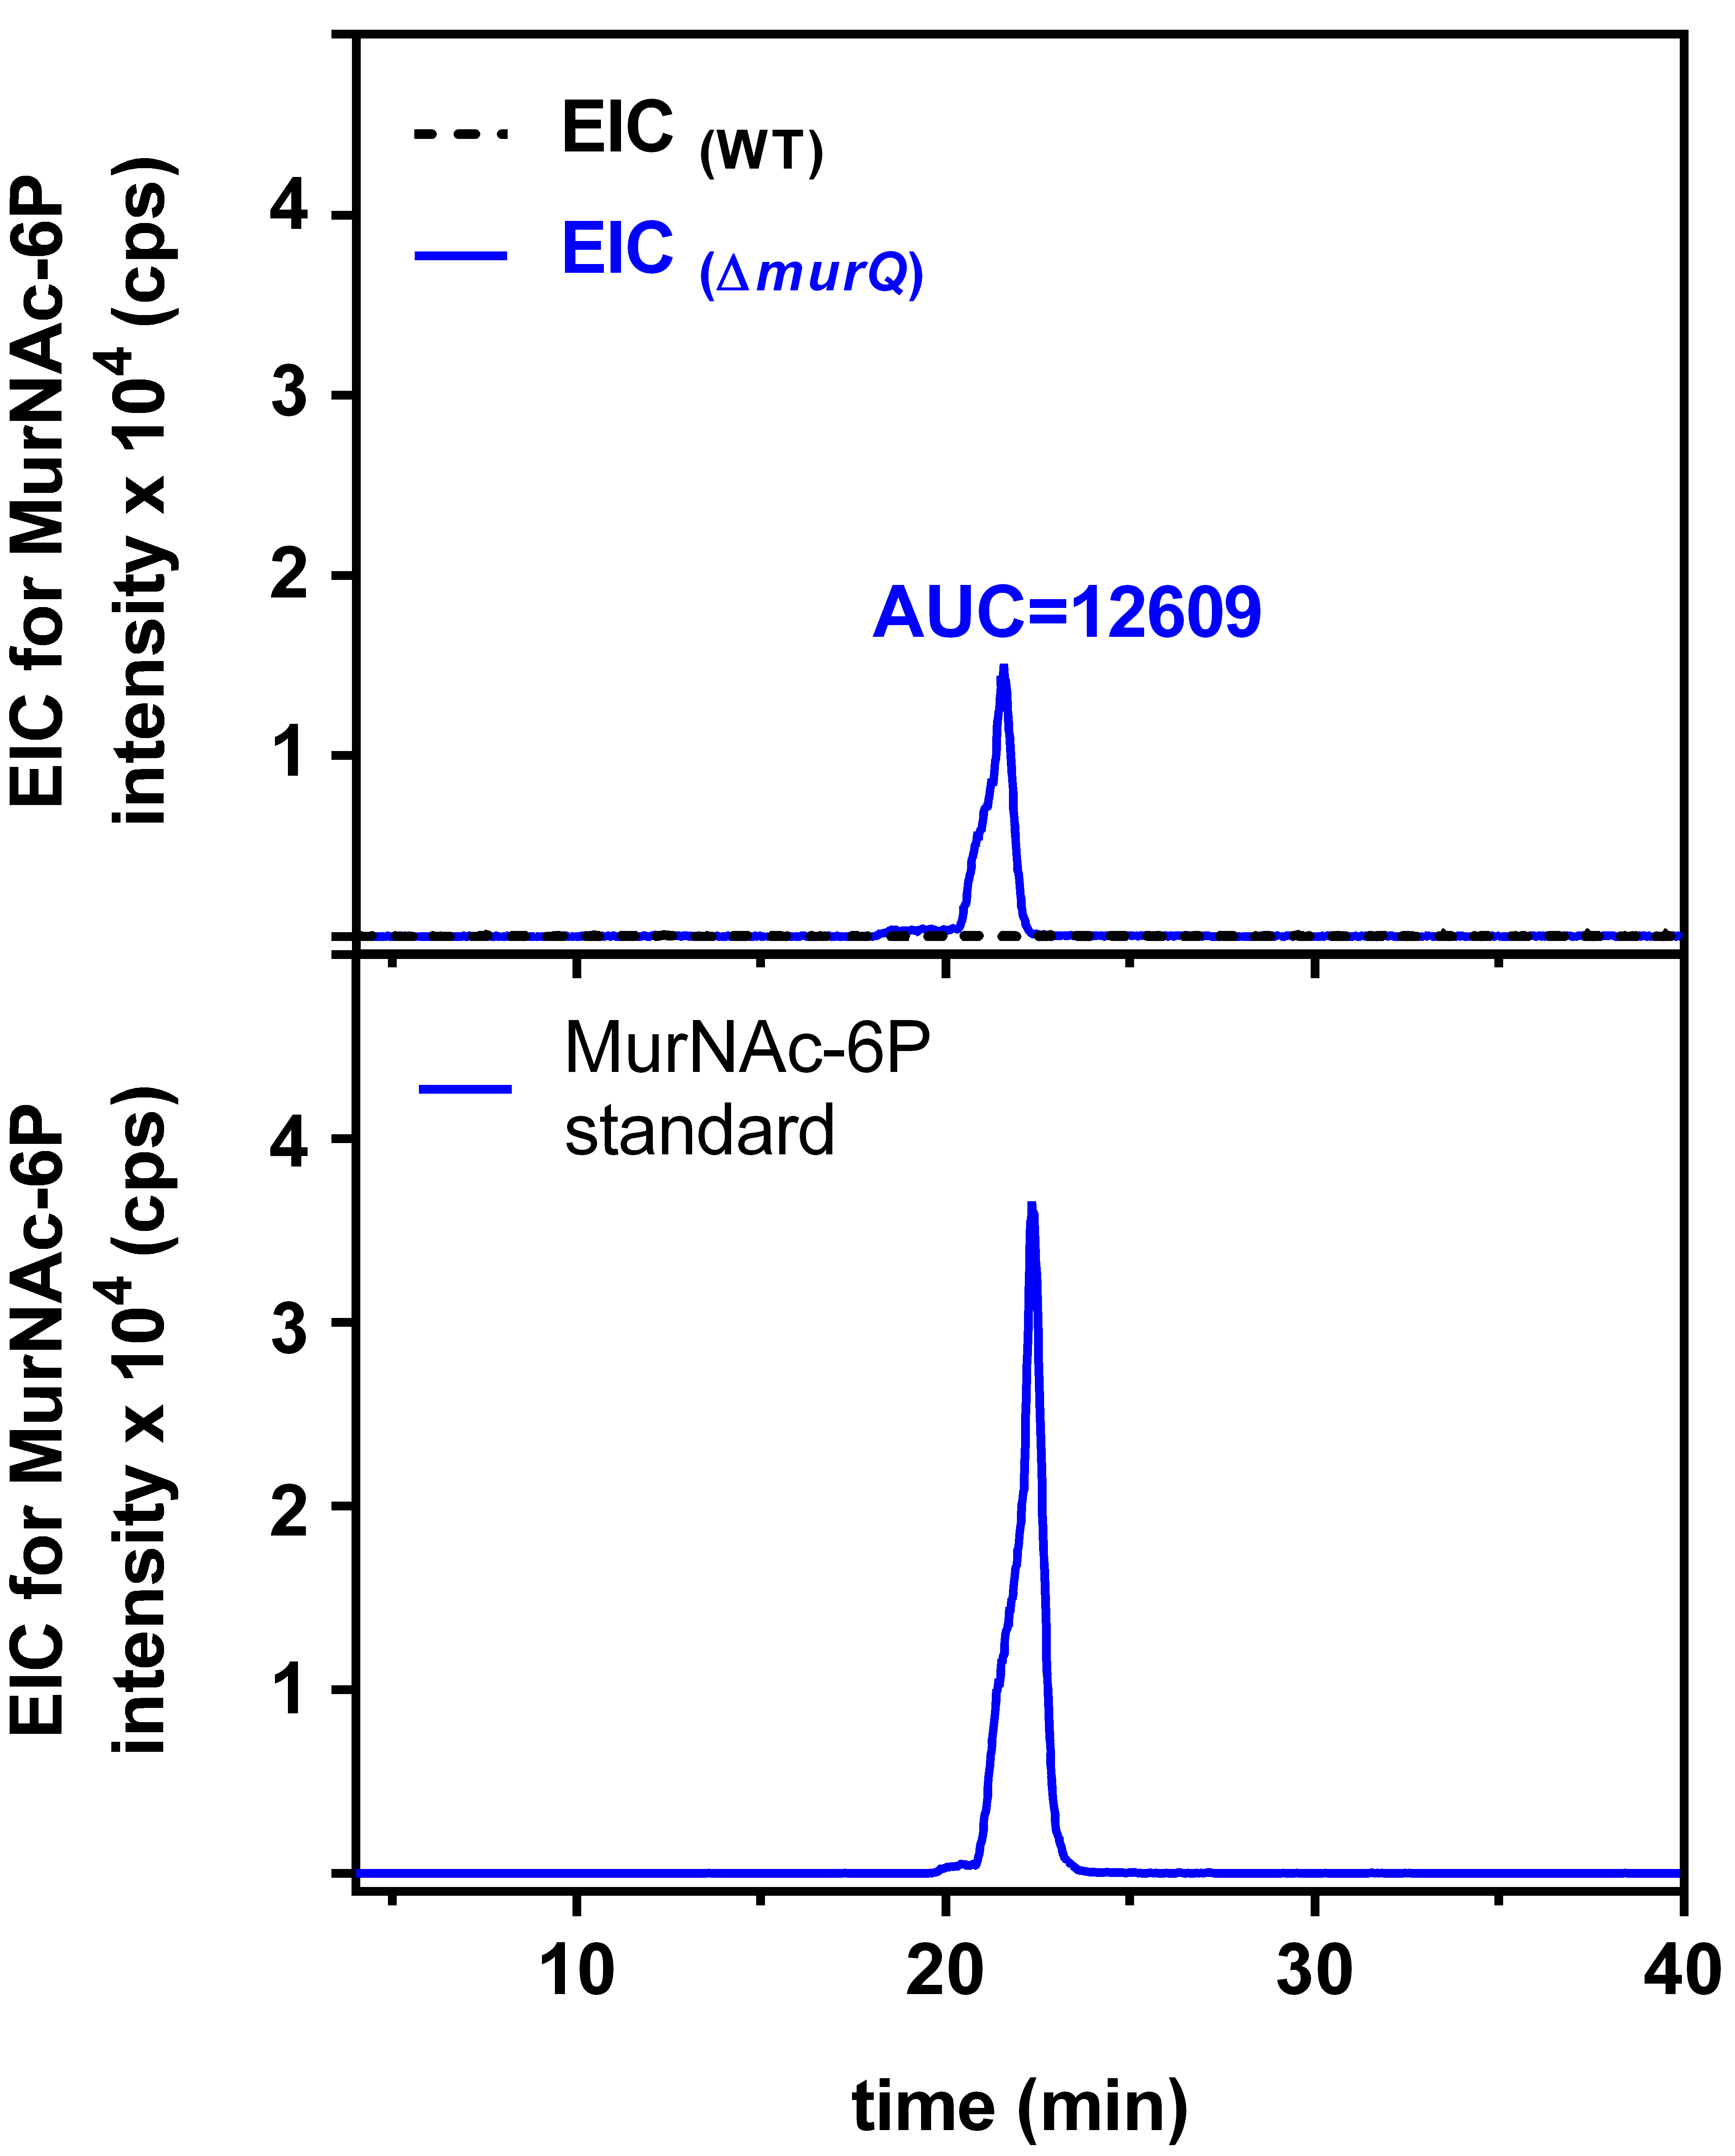
Figure 3. Extracted ion chromatogram (EIC) for MurNAc-6P. Searching for an EIC of 372.071 m/z of MurNAc-6P revealed no signal for wild type (WT) cells (interrupted black line) but a clear signal for ∆murQ mutant cells (blue line; upper panel). The area under the curve (AUC) for the latter signal allows to quantify the amount of MurNAc-6P using a MurNAc-6P standard of known concentration (lower panel) (Unsleber et al., 2017).
Notes
- Use only HPLC grade chemicals and ultrapure Millipore water for sample preparation and mass spectrometry analysis.
- Wash bacterial cultures extensively with Millipore water to remove contamination of salt and components from the LB broth medium.
- Avoid vortexing of the bacterial suspension during washing to prevent cell lysis.
- Freeze bacterial cultures at -80 °C to improve subsequent cell disruption with the glass beads.
- Use ice-cold acetone to precipitate efficiently remaining proteins in the cytosolic fractions prior to LC-MS measurements.
- Perform detection of MurNAc-6P in negative ion mode. MurNAc-6P could not be detected in positive ion mode.
Recipes
- Medium Luria-Bertani (LB) broth, Miller
5 g yeast extract
10 g tryptone
10 g sodium chloride
in 1 L distilled water
Autoclave medium at 121 °C for 15 min - LC-MS calibrant (10 mM sodium formate)
12.5 ml Millipore water
12.5 ml propan-2-ol
50 µl formic acid
250 µl 1 N NaOH - HPLC buffer A: 0.1% formic acid, 0.05% ammonium formate (pH 3.2)
1 ml formic acid
0.5 g ammonium formate
1 L autoclaved Millipore water
Acknowledgments
This protocol was adapted from Borisova et al. (2016). Christoph Mayer is supported by the Deutsche Forschungsgemeinschaft (DFG) grants MA2436/7, SFB766/A15 and GRK1708/B2.
References
- Borisova, M., Gaupp, R., Duckworth, A., Schneider, A., Dalugge, D., Mühleck, M., Deubel, D., Unsleber, S., Yu, W., Muth, G., Bischoff, M., Götz, F. and Mayer, C. (2016). Peptidoglycan recycling in Gram-positive bacteria is crucial for survival in stationary phase. MBio 7(5).
- Jaeger, T., Arsic, M. and Mayer, C. (2005). Scission of the lactyl ether bond of N-acetylmuramic acid by Escherichia coli "etherase". J Biol Chem 280(34): 30100-30106.
- Litzinger, S., Duckworth, A., Nitzsche, K., Risinger, C., Wittmann, V. and Mayer, C. (2010). Muropeptide rescue in Bacillus subtilis involves sequential hydrolysis by β-N-acetylglucosaminidase and N-acetylmuramyl-L-alanine amidase. J Bacteriol 192(12): 3132-3143.
- Reith, J. and Mayer, C. (2011). Peptidoglycan turnover and recycling in Gram-positive bacteria. Appl Microbiol Biotechnol 92(1): 1-11.
- Uehara, T., Suefuji, K., Jaeger, T., Mayer, C. and Park, J. T. (2006). MurQ Etherase is required by Escherichia coli in order to metabolize anhydro-N-acetylmuramic acid obtained either from the environment or from its own cell wall. J Bacteriol 188(4): 1660-1662.
- Unsleber, S., Borisova, M. and Mayer, C. (2017). Enzymatic synthesis and semi-preparative isolation of N-acetylmuramic acid 6-phosphate. Carbohydr Res 445: 98-103.
Article Information
Copyright
© 2017 The Authors; exclusive licensee Bio-protocol LLC.
How to cite
Borisova, M. and Mayer, C. (2017). Analysis of N-acetylmuramic acid-6-phosphate (MurNAc-6P) Accumulation by HPLC-MS. Bio-protocol 7(15): e2420. DOI: 10.21769/BioProtoc.2420.
Category
Microbiology > Microbial physiology > Membrane property
Microbiology > Microbial biochemistry > Other compound
Biochemistry > Carbohydrate > Peptidoglycan
Do you have any questions about this protocol?
Post your question to gather feedback from the community. We will also invite the authors of this article to respond.
![]() Tips for asking effective questions
Tips for asking effective questions
+ Description
Write a detailed description. Include all information that will help others answer your question including experimental processes, conditions, and relevant images.