
- Submit a Protocol
- Receive Our Alerts
- EN

- Protocols

- Articles and Issues
- For Authors
- About
- Become a Reviewer

Measurement of Arabidopsis thaliana Plant Traits Using the PHENOPSIS Phenotyping Platform
Published: Vol 8, Iss 4, Feb 20, 2018 DOI: 10.21769/BioProtoc.2739 Views: 8852
Reviewed by: Tie LiuPaweł KrajewskiJason Liang Pin Ng
Original research article
The authors used this protocol in:
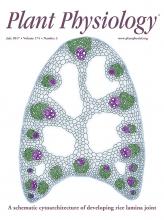
Jul 2017

Protocol Collections
Comprehensive collections of detailed, peer-reviewed protocols focusing on specific topics


Related protocols
Abstract
High-throughput phenotyping of plant traits is a powerful tool to further our understanding of plant growth and its underlying physiological, molecular, and genetic determinisms. This protocol describes the methodology of a standard phenotyping experiment in PHENOPSIS automated platform, which was engineered in INRA-LEPSE (https://www6.montpellier.inra.fr/lepse) and custom-made by Optimalog company. The seminal method was published by Granier et al. (2006). The platform is used to explore and test various ecophysiological hypotheses (Tisné et al., 2010; Baerenfaller et al., 2012; Vile et al., 2012; Bac-Molenaar et al., 2015; Rymaszewski et al., 2017). Here, the focus concerns the preparation and management of experiments, as well as measurements of growth-related traits (e.g., projected rosette area, total leaf area and growth rate), water status-related traits (e.g., leaf dry matter content and relative water content), and plant architecture-related traits (e.g., stomatal density and index and lamina/petiole ratio). Briefly, a completely randomized (block) design is set up in the growth chamber. Next, the substrate is prepared, its initial water content is measured and pots are filled. Seeds are sown onto the soil surface and germinated prior to the experiment. After germination, soil watering and image (visible, infra-red, fluorescence) acquisition are planned by the user and performed by the automaton. Destructive measurements may be performed during the experiment. Data extraction from images and estimation of growth-related trait values involves semi-automated procedures and statistical processing.
Keywords: PhenotypingBackground
Phenotyping of plant traits is an important aspect of plant sciences. It can be defined as a set of methodologies used to measure plant traits with certain accuracy and precision at different scales of organization (Fiorani and Schurr, 2013). A renaissance of plant phenotyping was brought by the development of automated phenotyping platforms and the creation of new tools for image analysis (Granier and Vile, 2014). Automated plant phenotyping is useful in many aspects of plant biology, such as ecophysiology (Vile et al., 2012), genetics (Bac-Molenaar et al., 2016), and molecular biology (Baerenfaller et al., 2012). It is then important for the broader readership to understand how these platforms work and what can be achieved. This protocol focuses on one particular installation, namely PHENOPSIS (Granier et al., 2006). PHENOPSIS is a custom-made phenotyping platform (growth chamber, automaton, and computer software), manufactured by Optimalog company and it is especially well-suited for analyses of small plants, such as Arabidopsis thaliana. The platform enables growing up to 504 A. thaliana plants simultaneously. Each plant is grown in a separate pot. Each pot can be automatically weighed and watered to a target value, thus it is feasible to monitor soil water content (SWC) individually and automatically adjust it. This feature of the platform makes it perfect for the application of water deficit treatments. PHENOPSIS automatically takes images of plant rosettes. Images can be of four types: RGB zenithal, RGB lateral, infrared, and fluorescence. In addition, many other non-destructive or destructive measurements are also available with some human involvement, e.g., transpiration, stomatal conductance, phenological stage, individual leaf area, epidermal cell density, extent of endoreduplication, and root weight. Because each of these measurements would require a separate lengthy manual, this protocol focuses on the basic platform operation, as well as measurements of leaf morphology and water status. The video of the platform in action is available online (http://bioweb.supagro.inra.fr/phenopsis/InfoBDD.php).
Materials and Reagents
- Double-sided tape (Scotch 12 x 6.3 mm dispensed, permanent, clear)
- Single-sided tape (Crystal clear tape Scotch 19 x 33 mm)
- Template sheets for leaf scanning
- Outer pots (APTE Society, http://www.apte.fr/)
- Inner perforated pots (outer pots hand perforated with a Dremel 4000)
- Pot labels (Point label, soft plastic 1.3 x 6 cm, BIER: http://www.fournitures-horticoles.com/magasin/catproduits.php?idgdf=9)
- Wooden toothpicks
- Microscope slide (Knittel Glass 76 x 26 mm, Starfrost)
- Pencil
- Fine permanent marker (Staedtler permanent, Lumacolor)
- Cylindrical containers for soil drying (50 x 50 mm, Servilab, catalog number: 8668770 )
- Paper bags for plant tissue drying (7 x 12 cm: http://www.beaumont-group.fr/produit/kraft-blanchi-frictionne-neutre-2/)
- Scalpel (Swann-Morton, Carbon Steel Surgical blades)
- Pincers (S MurrayTM Stainless Steel Watchmaker Forceps 11 cm, Fisher Scientific)
- A. thaliana seeds
- Agricultural soil (from Mauguio city, near Montpellier, France: N 43 37′ 01″, E 4 00′ 33″)
- Compost (Neuhaus N2)
- Clear nail polish (Maybelline New York, express Finish 40)
- Ammonium dihydrogen phosphate (H2PO4NH4) (VWR, catalog number: 21305.290 )
- Potassium nitrate (KNO3) (VWR, catalog number: 26869.291 )
- Fe (E.D.D.H.A) (SEQUESTRENE 138 FE 100 SG)
- Nitric acid (HNO3) 52% (VWR, catalog number: 20412.362 )
- Boric acid (H3BO3) (Merck, catalog number: 1.00165.0100 )
- Manganese(II) sulfate monohydrate (MnSO4·H2O) (VWR, catalog number: 25303.233 )
- Copper(II) sulfate pentahydrate (CuSO4·5H2O) (Sigma-Aldrich, catalog number: C2857-250G )
Note: This product has been discontinued. - Zinc sulfate heptahydrate (ZnSO4·7H2O) (Avantor Performance Materials, J.T. Baker, catalog number: 4382-01 )
- Ammonium molybdate tetrahydrate, (NH4)6Mo7O24∙4H2O (Sigma-Aldrich, catalog number: A7302-100G )
- Nutrient solution (see Recipes)
- Microelement solution (see Recipes)
Equipment
- PHENOPSIS phenotyping platform (Figure 1)
- Growth chamber
- Robotic arm (custom made by Optimalog: https://www.optimalog.com/phenopsis)
- Precision balance (Precisa, model: XB620C )
- Watering tubes
- RBG camera (Prosilica GC1600 (Allied Vision Technologies, model: PROSILICA GC 1600 ) with Computar Varifocal Megapixel M3Z1228C-MP (CBC, Computar, model: M3Z1228C-MP ), 12-36 mm, monture C zoom lens)
- Controlling computer (Dell)
- Growth chamber
- Laptop computer for phenological stage notations (HP ProBook 650 G1 (HP Development, model: HP ProBook 650 G1 ), Intel Core i3-4000M Dual Core, 8 GB 1600 DDR3L 2DM)
- Desktop scanner (Epson, model: Epson Perfection 4990 Photo )
- Desktop computer for image analyses (HP Compaq Pro 6300 MT PC+ (HP Development, model: HP Compaq Pro 6300 Microtower ) Intel Core i5-3470 3.2 G 6 M HD 2500 CPU, GB DDR3-1600 DIMM (2 x 4 GB) RAM + 250 GB 7200 RPM 3.5 HDD, AMD Radeon HD 7450 DP)
- Tablet monitor with a pen (Wacom, model: Cintiq 22HD )
- Stereo microscope with camera attachment (Leitz DMRB, Manta G-201B camera)
- Green LED lamp (Bulb LED GU10 Spot 1 W = 10 W green)
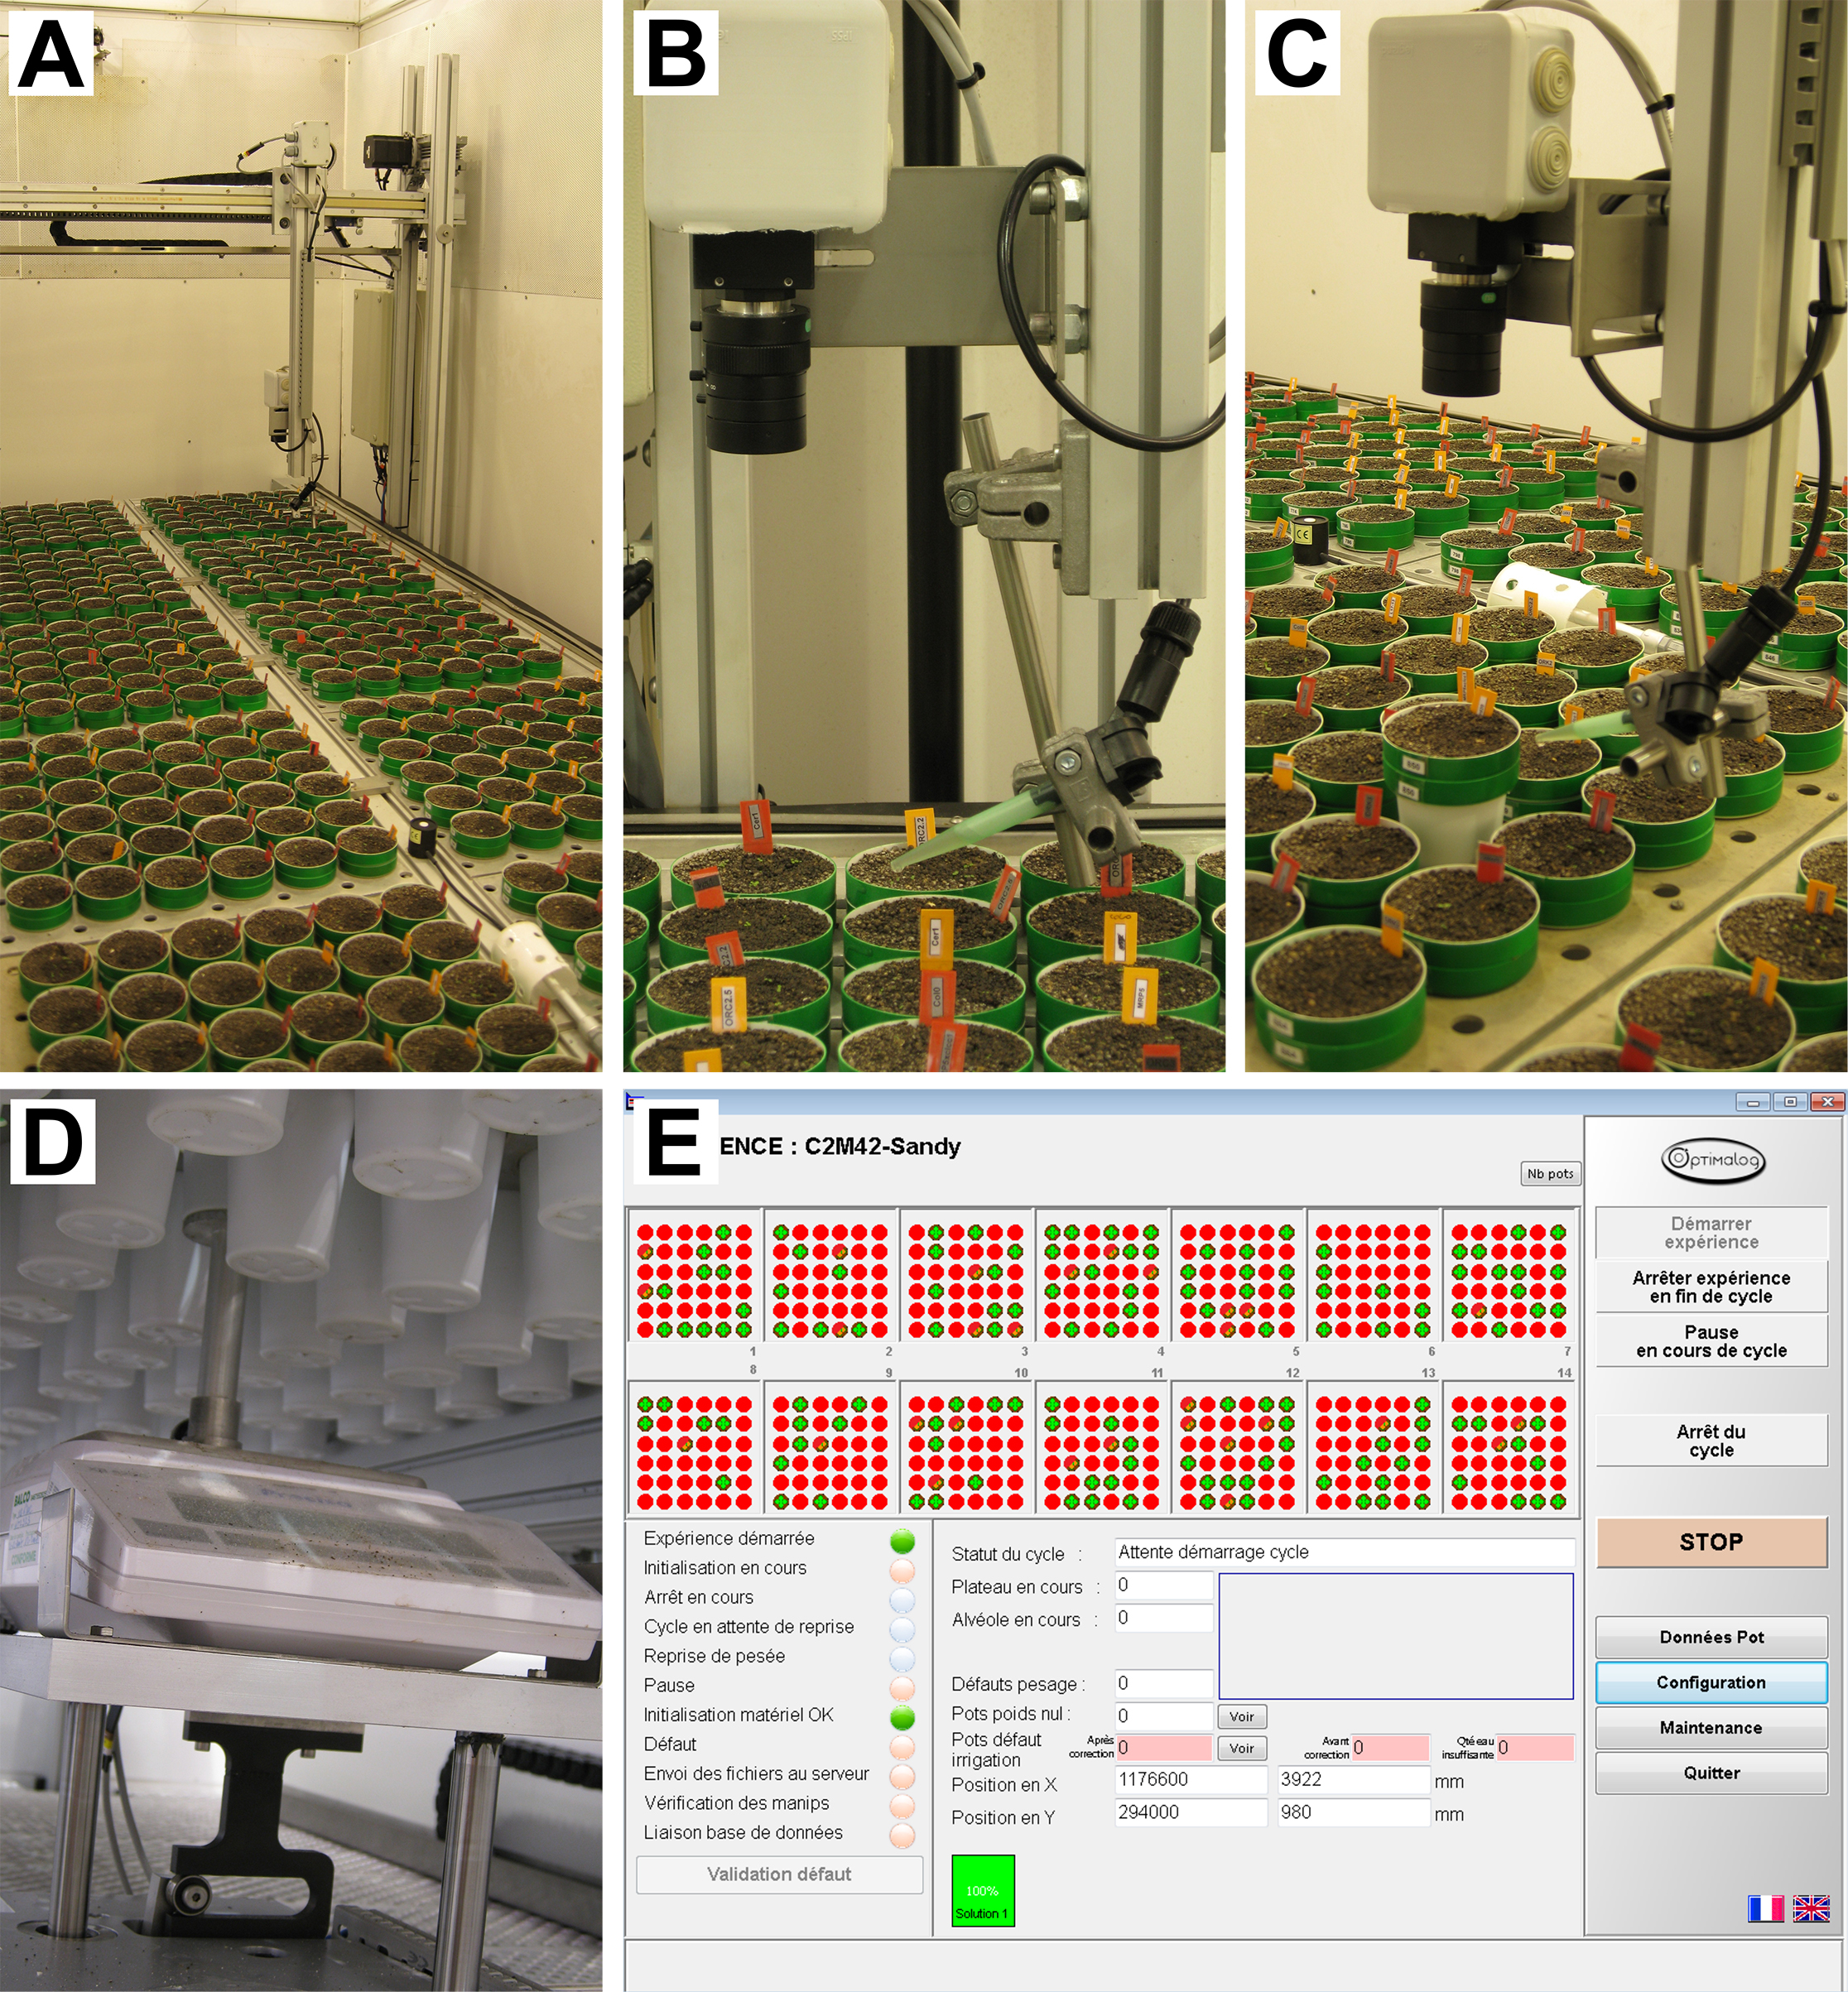
Figure 1. PHENOPSIS phenotyping platform. A. Overview of the growth chamber; B-C. Robotic arm with RBG camera and watering tube visible; D. Precision balance; E. A screenshot from Optimalog software controlling the platform.
Software
- Microsoft Excel
- ImageJ v1.51 (https://imagej.nih.gov/ij/) (Schneider et al., 2012)
- PHENOPSIS ImageJ macros (http://bioweb.supagro.inra.fr/phenopsis/MacroImageJ.php)
- Application for automaton control:
OPTIMA PLC software (https://optimalog.com/index.php?q=optimaplc_presentation) - Camera control: ProsilicaGigE (RGB Camera, Allied Vision); optionally: ThermaCAM Researcher (IR Camera, Flir), ImagingWin (Fluorescence camera, Walz)
Note: All the software is adapted by Optimalog to be used with Phenopsis. - R v3.4.1 (https://www.r-project.org/)
- Software for monitoring of environmental conditions:
Campbell Logger Net (https://www.campbellsci.com/loggernet)
Procedure
- Preparation of the experiment
- Design the experiment: experimental conditions (aerial conditions, photoperiod and water deficit treatments if considered), the duration of the experiment, tissue harvests, total number of plants in the platform and numbers of biological replicates. An example experiment could be: 21 A. thaliana genotypes grown in three watering regimes (well-watered, moderate and severe water deficit), 8 biological replicates per genotype per watering conditions. Using four experimental blocks, there will be 2 replicates per block (Figure 2).
- Create a randomized experimental design, for example using a customized R script (Figure 2). Pot coordinate randomization is advisable to diminish the effect of the position in the growth chamber which might significantly affect the results, e.g., growth rate and flowering time. Block numbers can be assigned to different areas of the chamber to test for the pot position effect. Assign numbers to pots and enter the data to a spreadsheet.
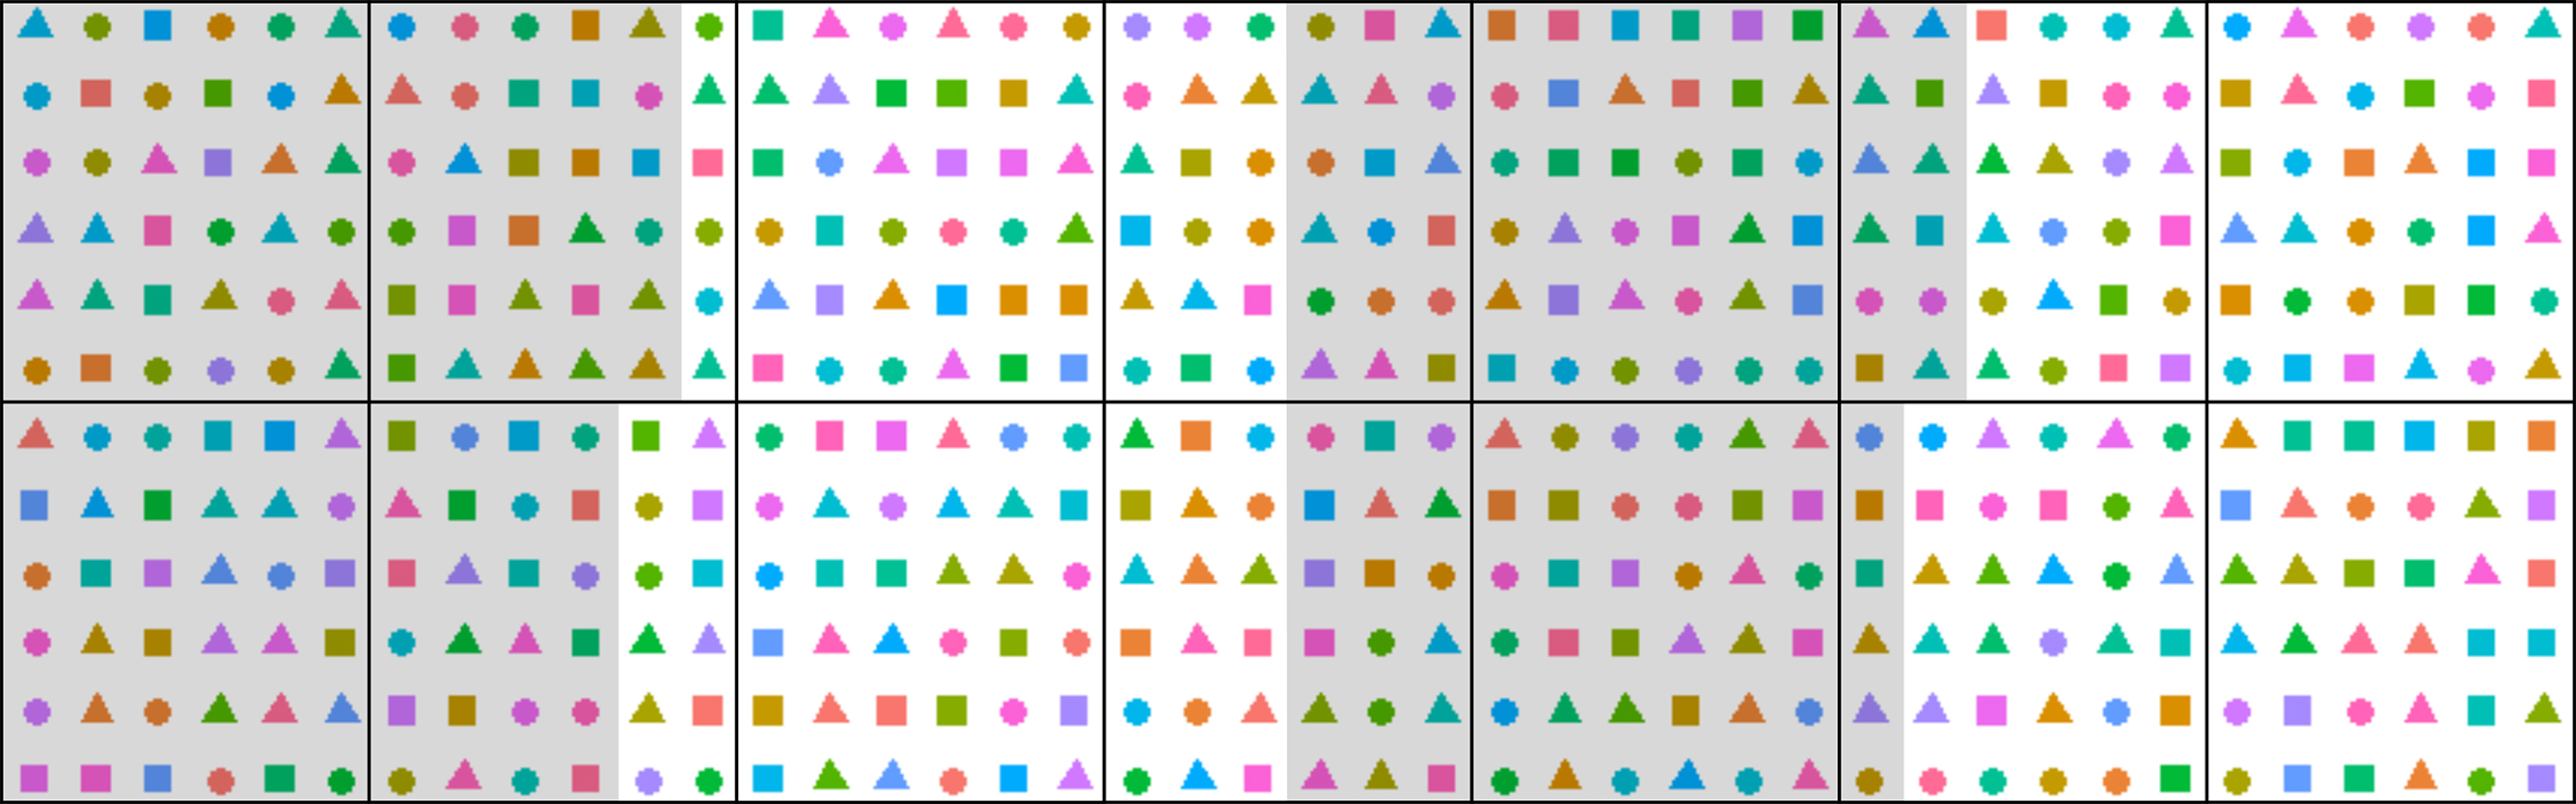
Figure 2. Schematic randomized experimental design in PHENOPSIS for a specific experiment with 21 A. thaliana genotypes, 3 watering regimes, and 8 biological replicates per genotype per watering conditions. Each point corresponds to one pot. Shapes correspond to watering regimes and colors to genotypes. Black lines divide the trays in PHENOPSIS growth chamber, and grey/white shading signify 4 blocks. Randomization reduces the effect of pot position in the growth chamber, and blocks can be used to investigate this effect. - Prepare two series of pots (inner and outer) labeled with an adhesive tape. Inner pots are perforated with elongated holes, to enhance the soil drying process if necessary (Figure 3).
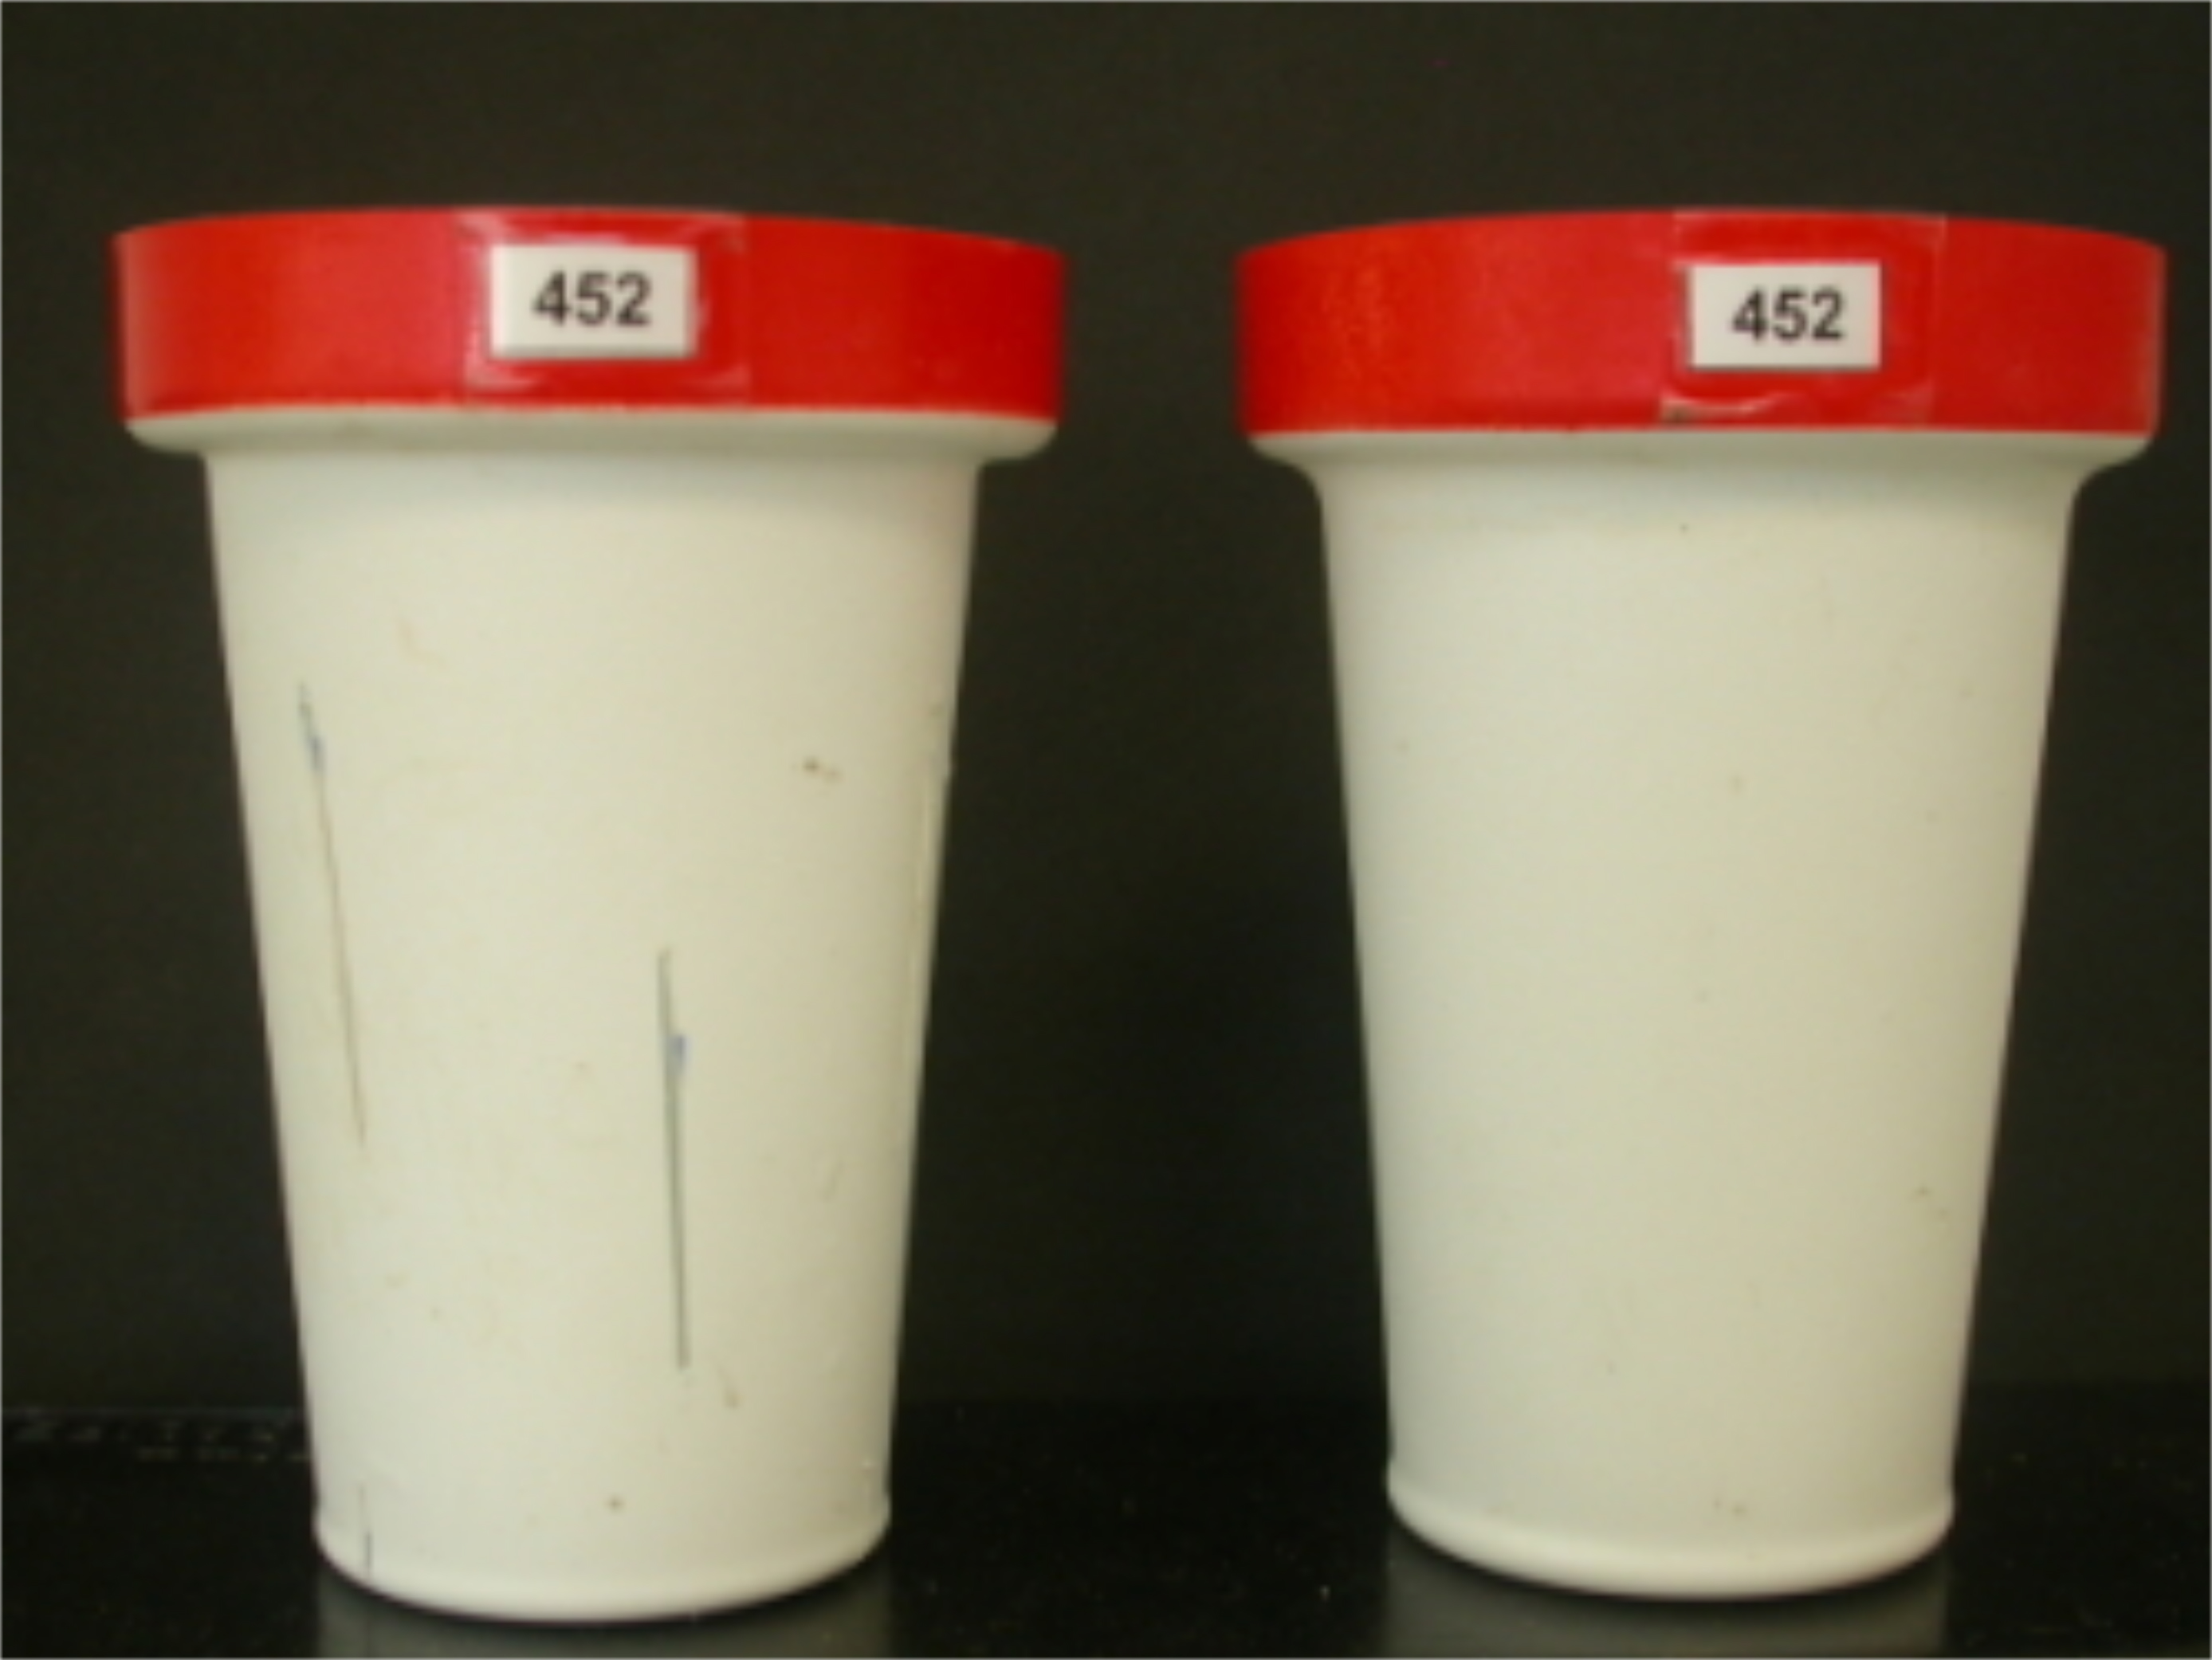
Figure 3. Pots used in PHENOPSIS experiments. Inner pots (left) have extended holes for enhanced soil drying (visible as two lines on the surface of the pot). Holes are nearly identical in all inner pots, thus differences in soil drying dynamics are minimal. Outer pots (right) are not perforated. Source: http://bioweb.supagro.inra.fr/phenopsis/. - Weigh the outer (Pout) and inner (Pin) pots. Enter the weights of the two empty pots into the spreadsheet.
- Prepare the substrate: Mix 50% agricultural soil with 50% compost.
Note: This substrate is dedicated for water deficit experiments, as it provides optimal water retention for such purpose. Other substrates may be used for other types of experiments. - Place the inner pot in the outer one and fill the inner pot with the mixed substrate, weigh the pots with the substrate (Total) and enter this weight into the spreadsheet. Collect and weigh one small soil sample (approx. 10 g) per every 10 pots (Swet).
- Dry the soil samples at 80 °C for 3 days.
- Rinse the soil surface with 10 ml of nutrient solution (see Recipes) for better seed imbibition.
- Sow approximately 5 A. thaliana seeds onto the soil surface using a wet toothpick and put the pots in the growth chamber (20.5 °C and 70% relative air humidity) in the dark for two days.
- Transfer the pots into the PHENOPSIS growth-chamber and adjust the environmental conditions (vapor pressure deficit, photoperiod, temperature, PAR [max: 200 µmol]).
- Spray the soil surface in all pots with deionized water 3 times per day until germination.
- Measure the weights of soil samples (Sdry) and include them in the spreadsheet. Each soil sample will represent 10 pots. Calculate the initial SWC of the substrate as follows:

- Calculate the wet (PSwet) and dry (PSdry) weights of soil as follows:

- Calculate the target weights of pots in two combinations for desired SWCs–with single (Targetsingle) and double (Targetdouble) pot. SWC will be defined here as g H2O g-1 dry soil.

If you plan to apply water deficit treatments, calculate target weights for both well-watered conditions and water deficit conditions.
- Design the experiment: experimental conditions (aerial conditions, photoperiod and water deficit treatments if considered), the duration of the experiment, tissue harvests, total number of plants in the platform and numbers of biological replicates. An example experiment could be: 21 A. thaliana genotypes grown in three watering regimes (well-watered, moderate and severe water deficit), 8 biological replicates per genotype per watering conditions. Using four experimental blocks, there will be 2 replicates per block (Figure 2).
- Management of the experiment
- Declare the experiment in the database (PhenopsisDB, http://bioweb.supagro.inra.fr/phenopsis/). Include information about seed stocks, watering regimes and other details of the experiment.
- Note the germination date for each pot.
- After germination, adjust the watering conditions in the Optimalog software. This software controls functions of the robotic arm, including measurements of pot weight, watering and imaging, and cycles during the day. The watering can be programmed using a spreadsheet with calculated pot weights for desired conditions. Set 1-2 weighing/watering cycles per day. Set the target SWC to 0.35 g H2O g-1 dry soil.
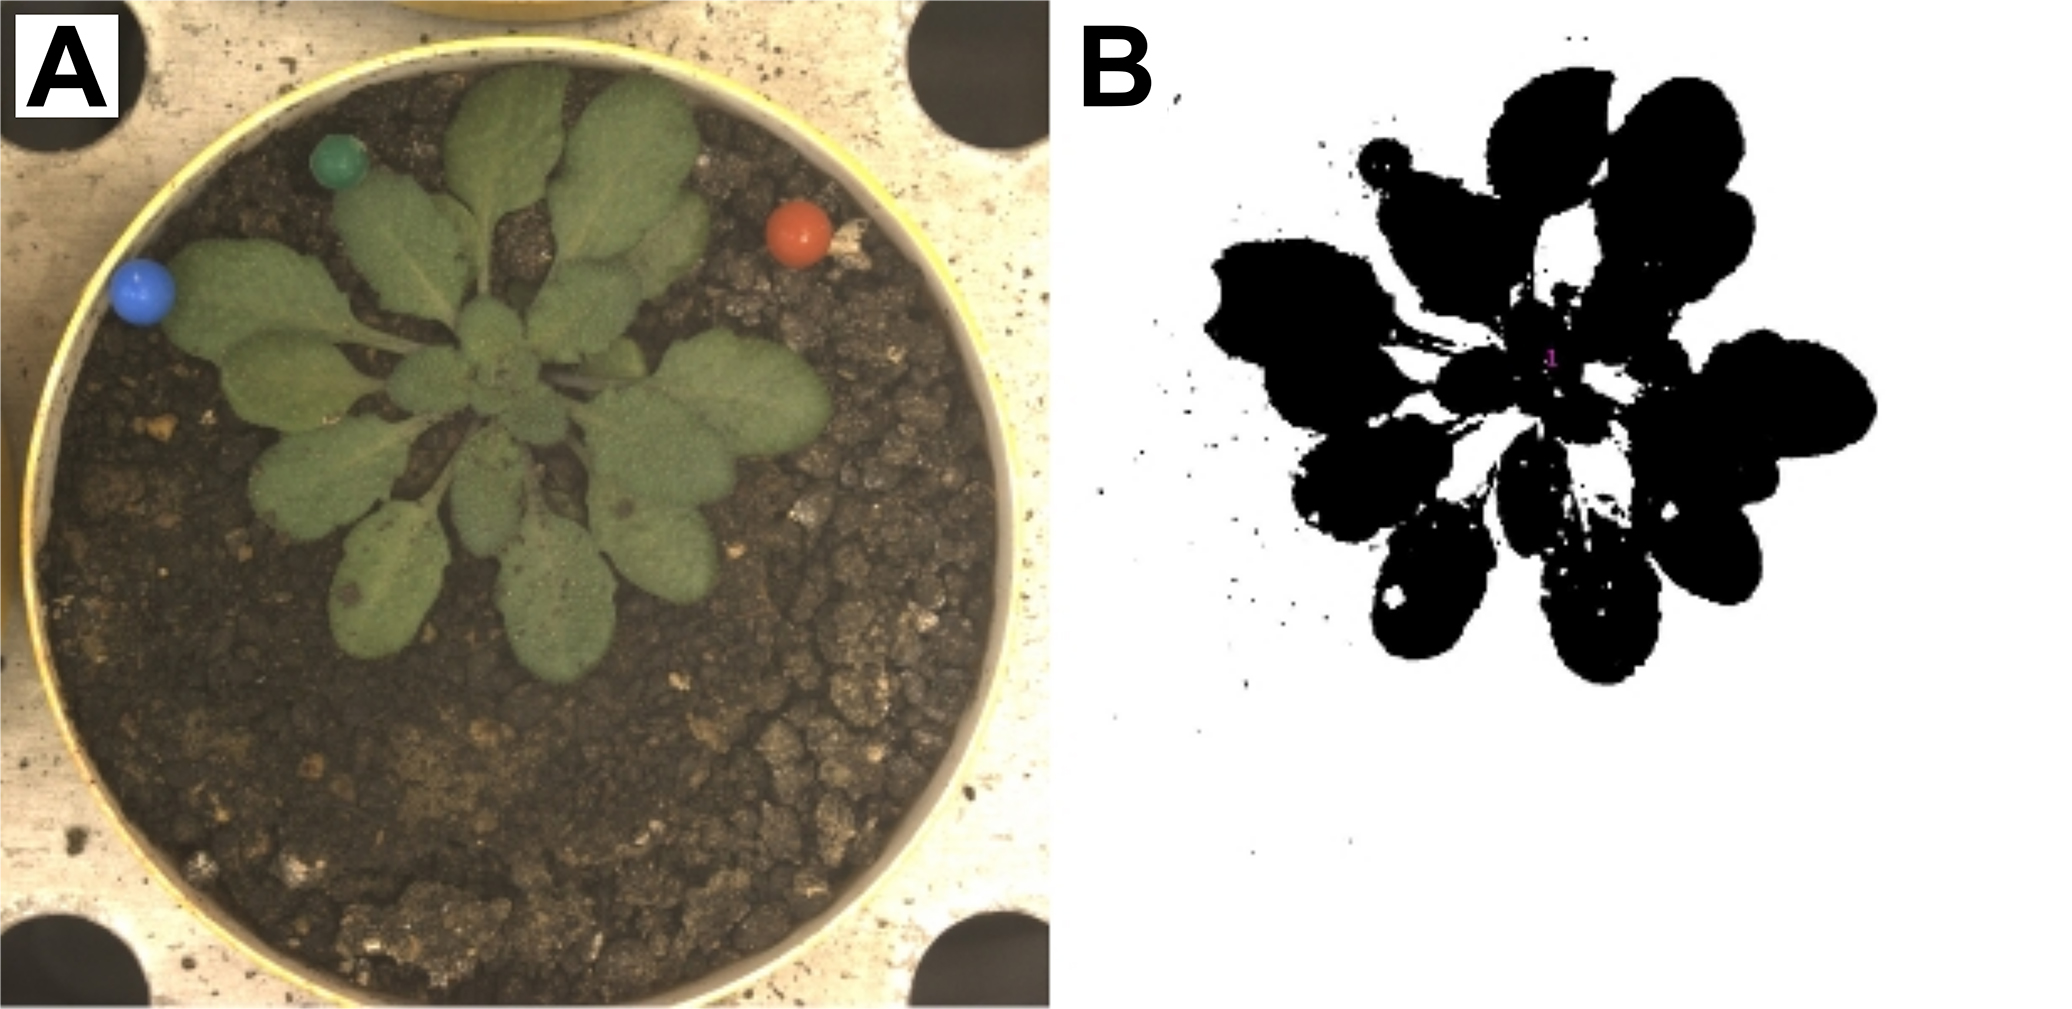
Figure 4. Example zenithal rosette image. A. Unprocessed image of A. thaliana rosette; B. Image processed using custom ImageJ macro that applies a color threshold to the picture. The resulting binary mask is created on the basis of green pixels. Source: http://bioweb.supagro.inra.fr/phenopsis/. - Adjust the properties of zenithal imaging in prosilicaGigE software. Program the robot to take one picture per day after the light was turned on in the growth chamber (Figure 4).
- Perform phenological stage notations three times per week. Notations take ca. 2 h for 2 people and 504 pots, i.e., one in the chamber looking at the plant phenological stages and the other noting on the laptop. Critical developmental stages should be noted (Boyes et al., 2001), as well as leaf number for each plant. Notations are best stored in spreadsheets.
- At the 4-leaf stage determined individually for each pot, remove excessive plants, leaving one healthy plant per pot.
- If the experiment involves different SWC treatments, the target weight should be appropriately adjusted (Targetsingle) upon the appearance of first true leaves, and outer pots should be removed for the soil drying period. After reaching the desired SWC, reintroduce the outer pot and adjust the target weight to Targetdouble. This needs to be done individually for each pot.
- Harvest plant tissue at previously specified growth stages. If metabolomic and transcriptomic analyses are considered, it is advisable to harvest the tissue at the specific time of the day to avoid diurnal fluctuations. Night time harvests can be done under green light in order to avoid activation of photosynthetic processes and induction of light-dependent gene expression.
- Declare the experiment in the database (PhenopsisDB, http://bioweb.supagro.inra.fr/phenopsis/). Include information about seed stocks, watering regimes and other details of the experiment.
- Biomass partitioning and leaf scans
- Remove the flowering stem and cut the rosette near the soil surface. Measure the rosette fresh weight (FWR).
- Enclose the rosette between sheets of wet paper towel in the Petri dish, and place the Petri dish in the cold room for 24 h.
- Carefully remove water droplets from the rosette with a paper towel, and measure the water-saturated (turgid) weight of the rosette (TWR).
- Excise all laminas from the rosette and stick them with double-sided tape to an A4 sheet of paper, according to their rank. The template for this sheet includes a calibration square for further analysis, and boxes for sample description (Figure 5). Measure the water-saturated weight of petioles after stripping the rosettes of laminas (TWP), and stick the petioles to the same sheet of paper.
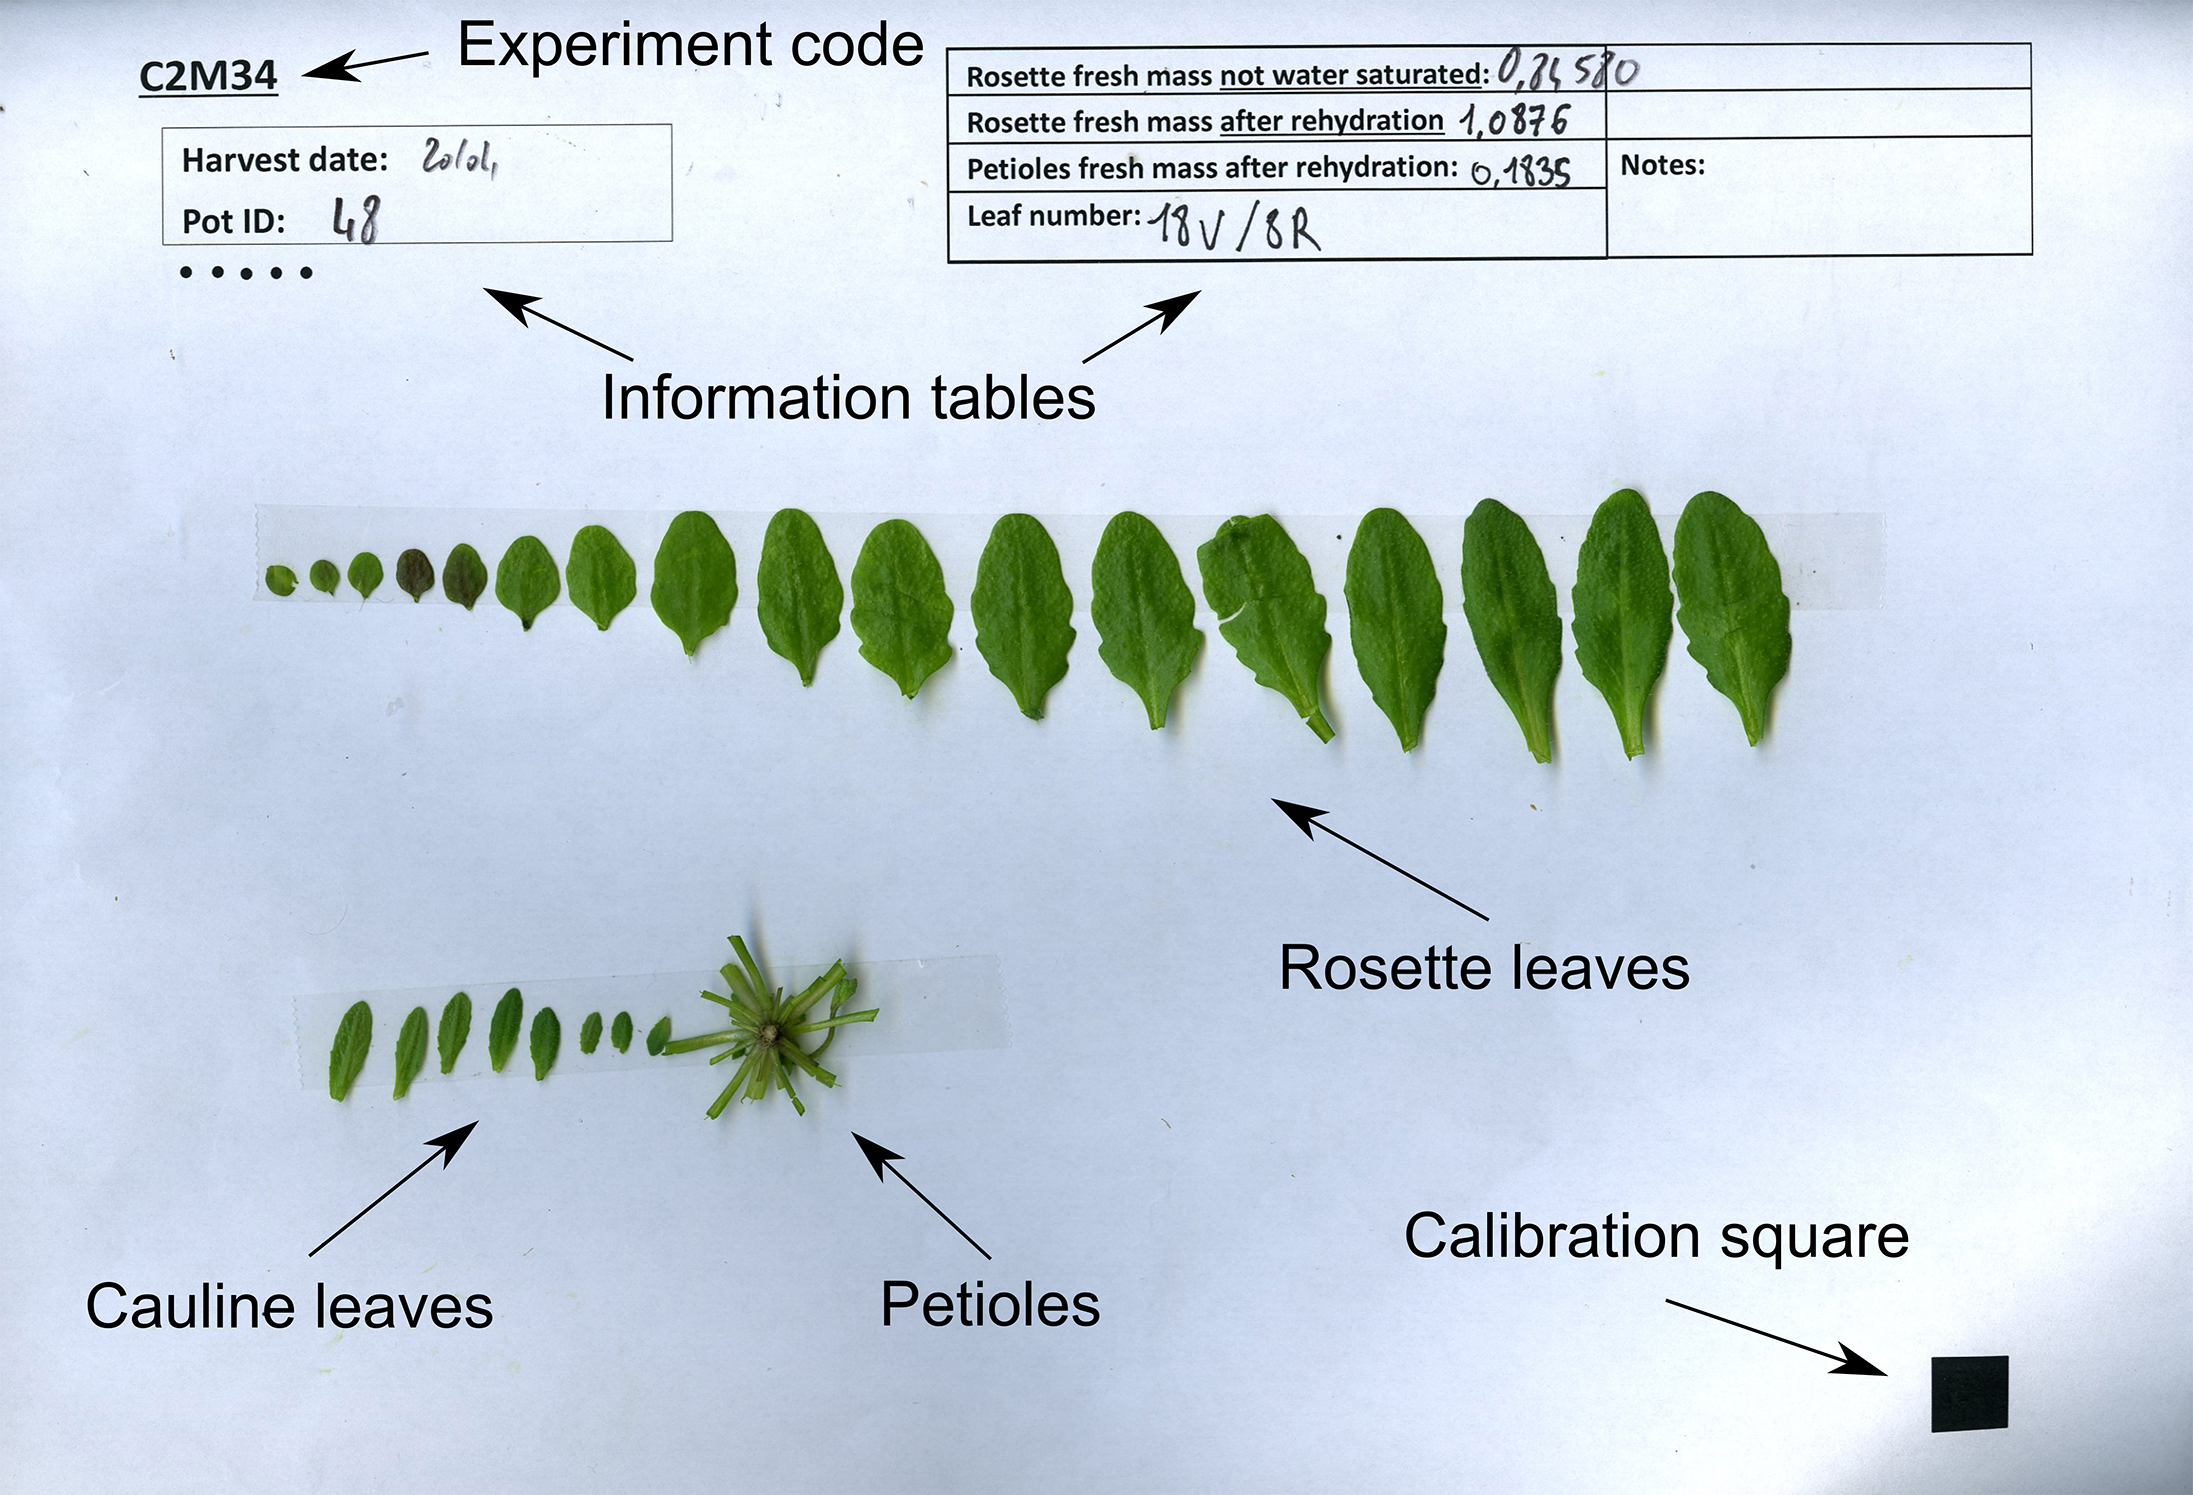
Figure 5. Example leaf scan with indicated weights and final leaf numbers - Count the final number of rosette (LN) and cauline leaves (LCN), and write down these numbers.
- Scan the paper sheets with leaves and collect the laminas and petioles of each plant to separate bags.
- Place the bags at 80 °C for 3 days, and afterwards measure the dry weights of laminas (DWL) and petioles (DWP).
- Remove the flowering stem and cut the rosette near the soil surface. Measure the rosette fresh weight (FWR).
- Stomatal density measurement
- Remove one leaf blade from the rosette (the largest leaf or a specific leaf rank). Cut it in half along the central nerve and stick both halves to a sheet of paper with double-sided tape, opposite sides up (Figure 6A).
- Cover the leaf blade with a thin layer of transparent nail polish. The nail polish needs to be not too viscous, and formation of air bubbles should be avoided.
- After 5 min of drying, stick one-sided tape to the nail polish layer, remove it carefully from the leaf blade, and stick it to the labeled microscope slide.
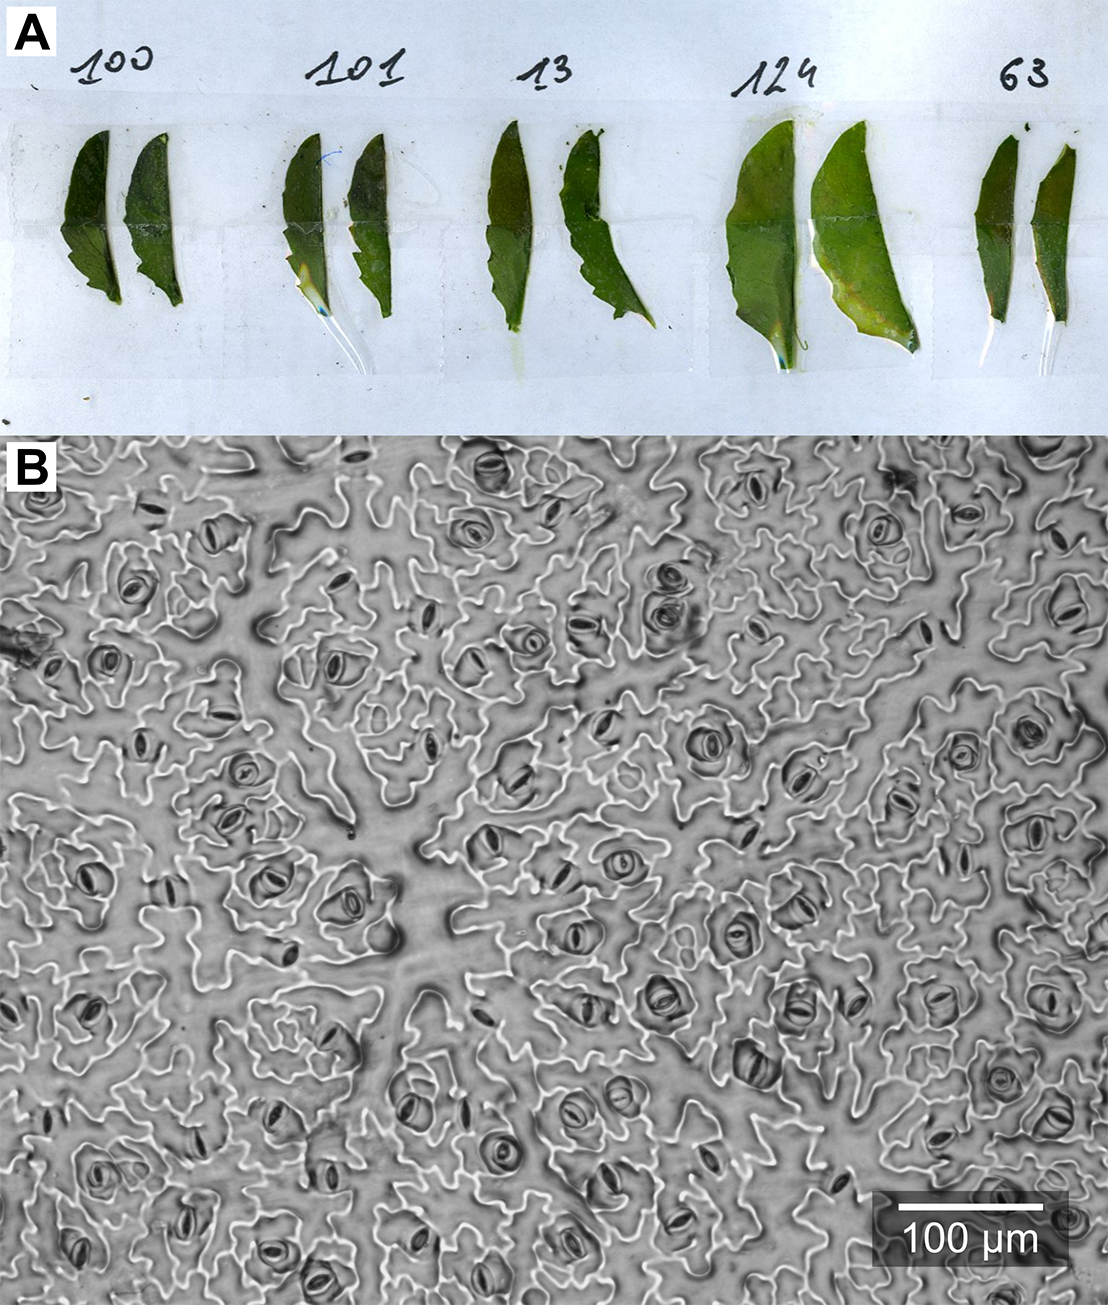
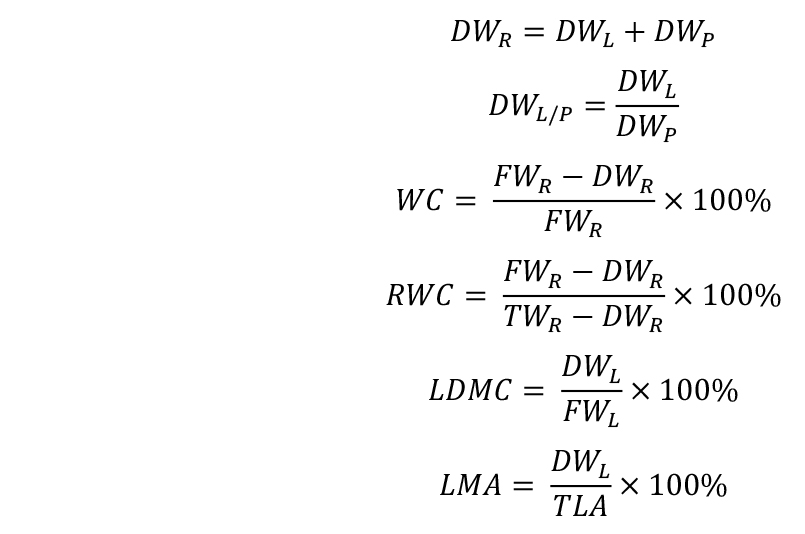
Figure 6. Epidermal imprints. A. Leaf blades after peeling-off the nail polish; B. Example microphotograph of an epidermal imprint.
- Remove one leaf blade from the rosette (the largest leaf or a specific leaf rank). Cut it in half along the central nerve and stick both halves to a sheet of paper with double-sided tape, opposite sides up (Figure 6A).
Data analysis
- Leaf scans
Analyze the leaf scans using a custom ImageJ macro (http://bioweb.supagro.inra.fr/phenopsis/MacroImageJ.php). The macro will prompt you to click on all the leaves and then calculate areas for each leaf. The sum of these areas for each plant is total leaf area (TLA). - Stomatal traits
- Place the slide under a stereo microscope. Take at least 3 good quality representative images from each epidermal imprint with 50-200 stomata visible at the area of the image (Iarea) (e.g., Figure 6B).
- At each image count both the number of stomata (Snum) and the number of the pavement cells (Pavnum). Stomatal counting can be performed using a custom ImageJ macro available online (http://bioweb.supagro.inra.fr/phenopsis/MacroImageJ.php). The provided link also contains adequate documentation with clear step-by-step description of how to perform cell counting.
- Place the slide under a stereo microscope. Take at least 3 good quality representative images from each epidermal imprint with 50-200 stomata visible at the area of the image (Iarea) (e.g., Figure 6B).
- Rosette projections
- Collect zenithal images that are to be used in the analysis. For successful curve fitting, one image per 4 days is required.
- Extract projected rosette areas (PRA) using custom ImageJ macros (http://bioweb.supagro.inra.fr/phenopsis/MacroImageJ.php).
- Collect zenithal images that are to be used in the analysis. For successful curve fitting, one image per 4 days is required.
- Calculated traits
- Calculate the trait values: rosette dry weight (DWR), lamina/petiole ratio (DWL/P), water content (WC), relative water content (RWC), leaf dry matter content (LDMC), and leaf mass per area (LMA):
- Calculate stomatal density (Sdens) and stomatal index (SI):

- Estimate the dynamics of leaf formation (Vile et al., 2012) using LOESS or curve fitting (Figure 7A):

where
Lnum is leaf number at the time of measurement,
a is the number of days after the formation of first true leaves,
a0 is the time when LN/2 leaves developed,
LN is the maximum leaf number,
b is the maximum rate of leaf production. - Estimate growth rate parameters (Bac-Molenaar et al., 2015) using curve fitting to projected rosette area data (Figure 7B). Depending on the complexity of the dataset, different functions can be used, such as simple exponential function:

where
A0 is initial rosette size,
r is the growth rate; or more complex sigmoidal function (Gompertz function):
where
Amax is the final rosette size, and b is the position along the time axis.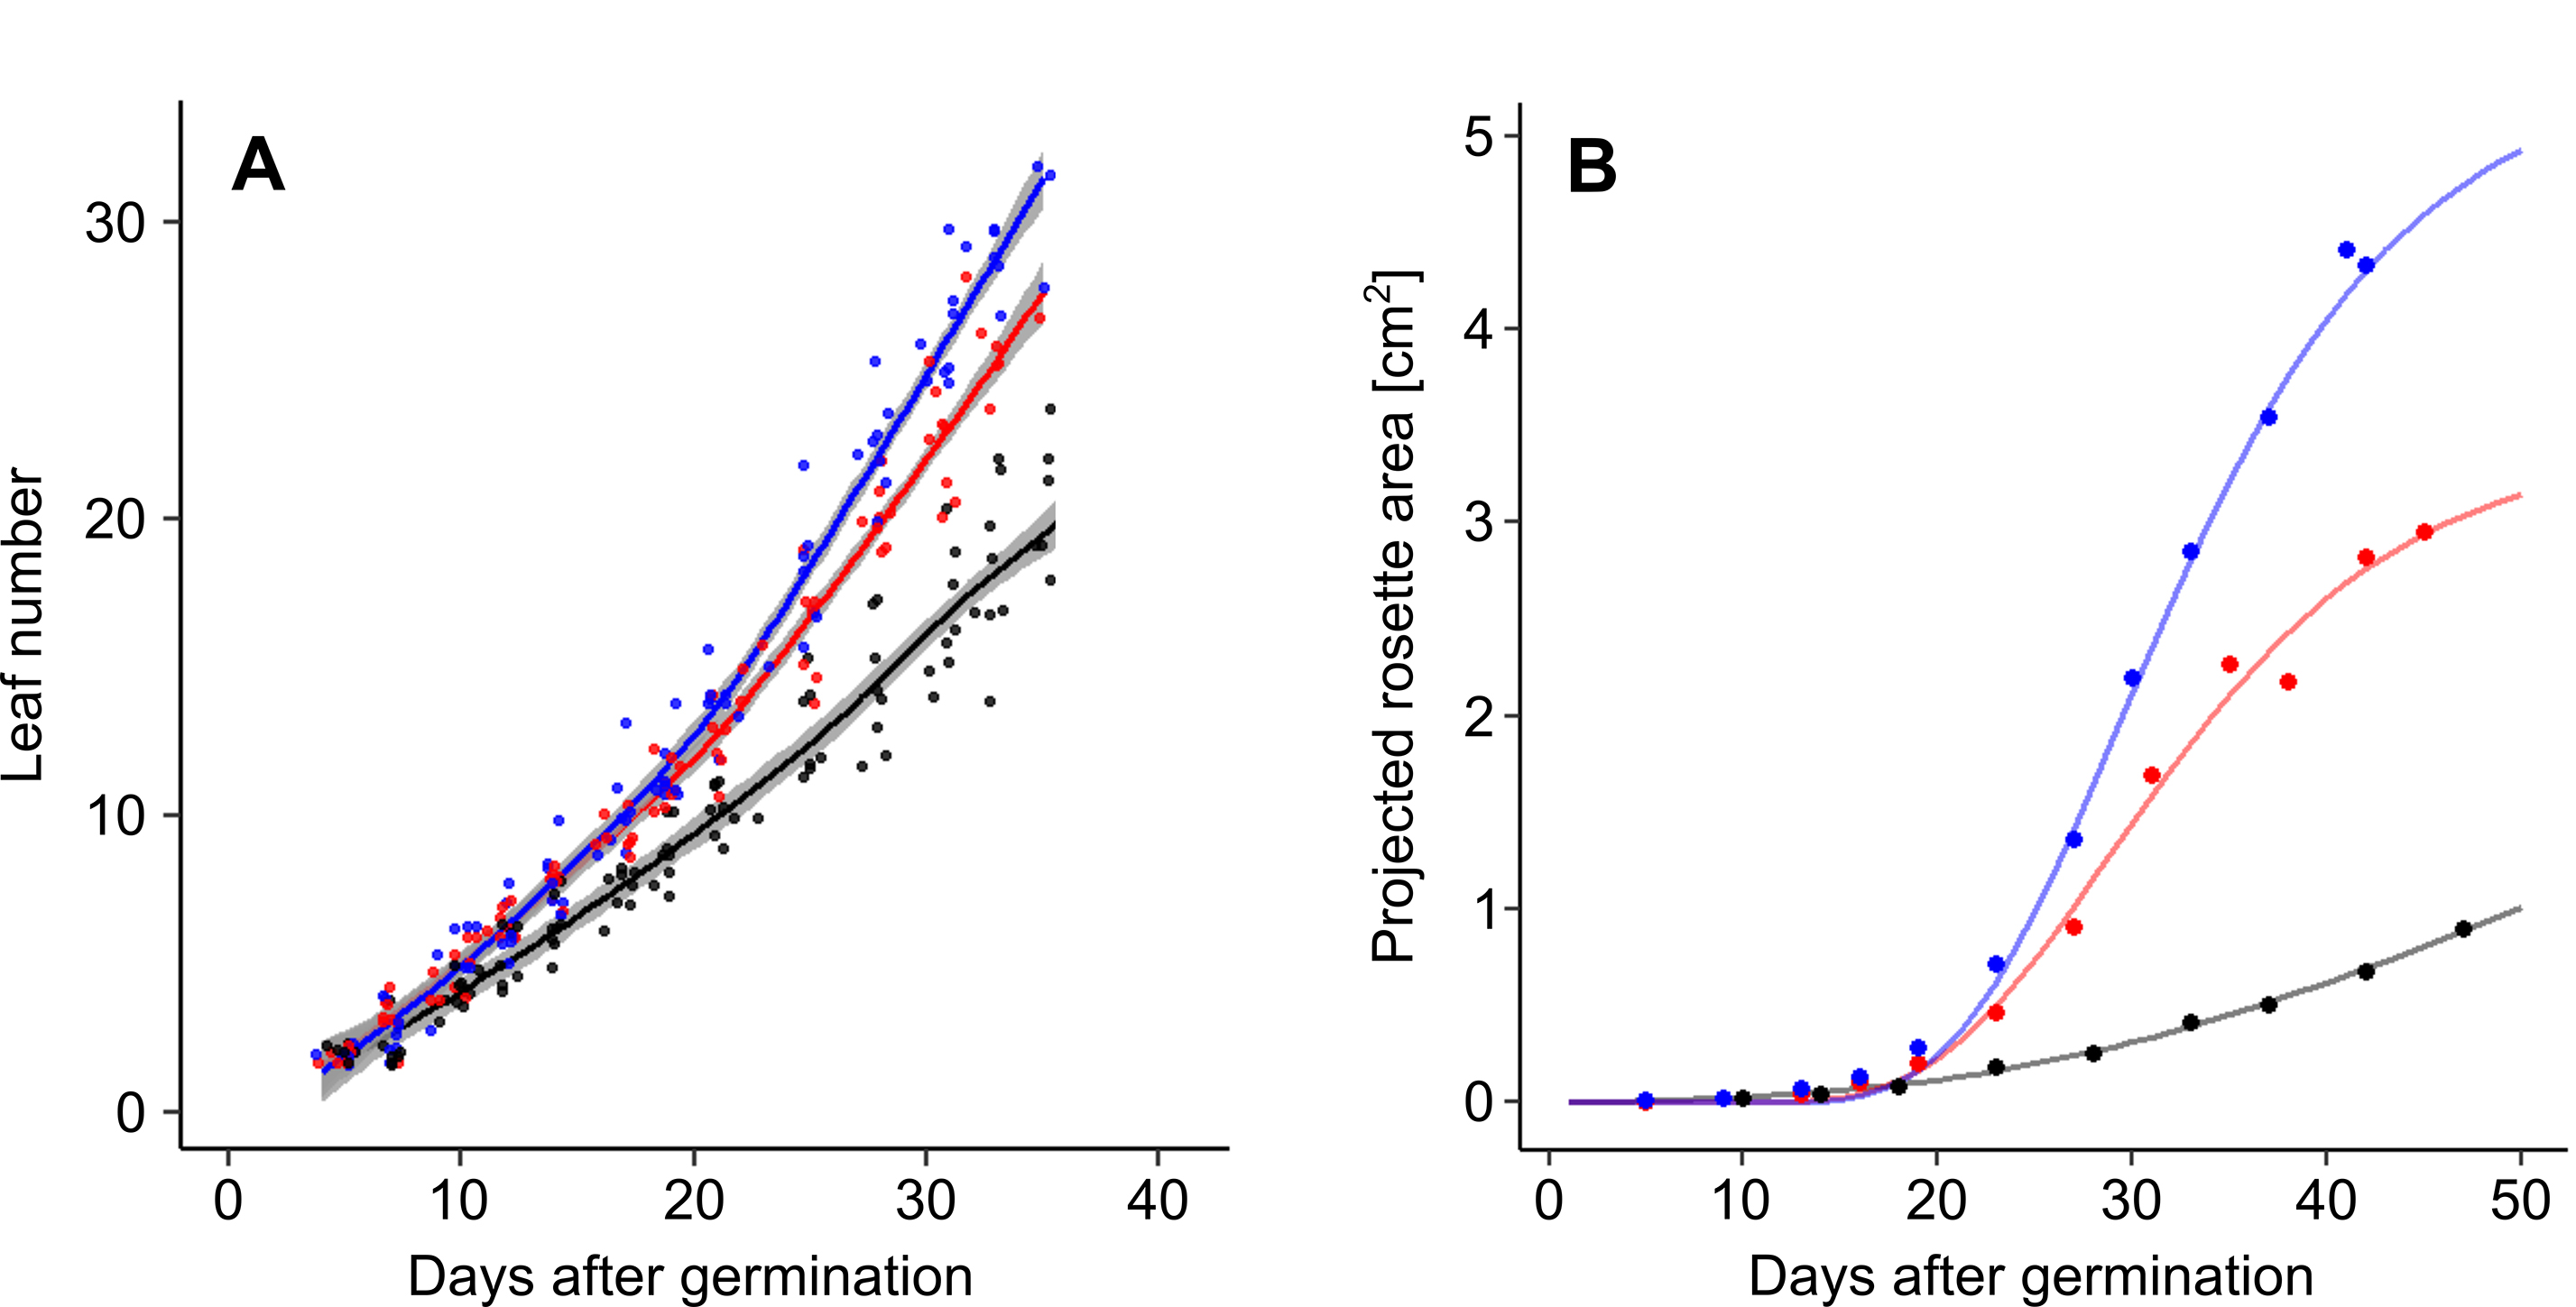
Figure 7. Dynamic growth measurement of A. thaliana Col-0 accession under well-watered conditions (blue), and moderate (red) and severe (black) water deficit. A. Changes in rosette leaf number. Data are derived from phenological stage notations. Lines and shading correspond to LOESS and standard error respectively. B. Changes in projected rosette area. Lines correspond to Gompertz curves.
Table 1. Traits measured in a basic PHENOPSIS experiment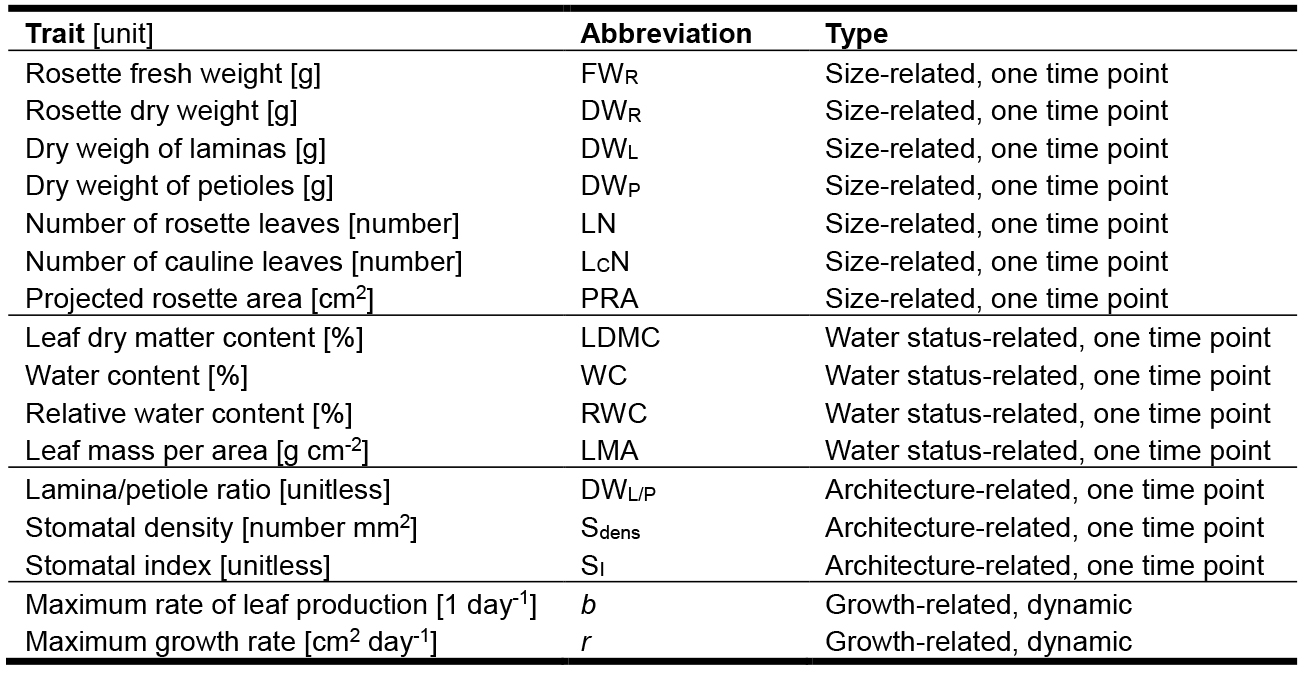
- The effects of the genotype (G), environment (E) and G x E interaction can be calculated using two-way analysis of variance (ANOVA). Multivariate effects may be analyzed by multivariate ANOVA (MANOVA). For these statistical methods, additional data analysis software is needed.
In A. thaliana accessions, the genotype effect tends to be strong, what makes direct observation of plant responses difficult. It is then advisable to, in addition to the analysis of absolute trait values, calculate and analyze the response ratios to different conditions as it was done by Rymaszewski et al. (2017). A response ratio is a logarithmized ratio of mean trait value under treatment conditions and mean trait value under control conditions. - Working on multiple genotypes and multiple traits, it is often beneficial to reduce the dimensionality using such methods as principal component analysis (PCA). These methods can also be utilized to visualize and better understand the data structure prior to the in-depth analysis.
- Calculate the trait values: rosette dry weight (DWR), lamina/petiole ratio (DWL/P), water content (WC), relative water content (RWC), leaf dry matter content (LDMC), and leaf mass per area (LMA):
Recipes
Note: Add deionized water to the required volume.
- Nutrient solution (150 L)
Adjust pH to 5.2-5.8 with HNO3H2PO4NH4 60 ml of 28.76 g/L stock KNO3 120 ml of 88.45 g/L stock Microelement solution 60 ml Fe (E.D.D.H.A) 7.2 g - Microelement solution (5 L)
H3BO3 1.85 g MnSO4∙H2O 1.90 g CuSO4∙5H2O 0.03 g ZnSO4∙7H2O 1.44 g (NH4)6Mo7O24∙4H2O 0.06 g
Acknowledgments
Access to the PHENOPSIS platform was permitted thanks to funds from the European Plant Phenotyping Network (EPPN, grant agreement No. 284443) funded by the FP7 Research Infrastructures Programme of the European Union. This research was also supported by a PRELUDIUM (2012/05/N/NZ9/01396) grant from the National Science Centre, Poland, awarded to W.R. PHENOPSIS developments are supported by FEDER-FSE-IEJ 2014-2020 Languedoc-Roussillon APSEVIR and PHENOPSIS 2.0 projects. Authors declare no conflict of interest.
References
- Bac-Molenaar, J. A., Granier, C., Keurentjes, J. J. and Vreugdenhil, D. (2016). Genome-wide association mapping of time-dependent growth responses to moderate drought stress in Arabidopsis. Plant Cell Environ 39(1): 88-102.
- Bac-Molenaar, J. A., Vreugdenhil, D., Granier, C. and Keurentjes, J. J. (2015). Genome-wide association mapping of growth dynamics detects time-specific and general quantitative trait loci. J Exp Bot 66(18): 5567-5580.
- Baerenfaller, K., Massonnet, C., Walsh, S., Baginsky, S., Buhlmann, P., Hennig, L., Hirsch-Hoffmann, M., Howell, K. A., Kahlau, S., Radziejwoski, A., Russenberger, D., Rutishauser, D., Small, I., Stekhoven, D., Sulpice, R., Svozil, J., Wuyts, N., Stitt, M., Hilson, P., Granier, C. and Gruissem, W. (2012). Systems-based analysis of Arabidopsis leaf growth reveals adaptation to water deficit. Mol Syst Biol 8: 606.
- Boyes, D. C., Zayed, A. M., Ascenzi, R., McCaskill, A. J., Hoffman, N. E., Davis, K. R. and Gorlach, J. (2001). Growth stage-based phenotypic analysis of Arabidopsis: a model for high throughput functional genomics in plants. Plant Cell 13(7): 1499-1510.
- Fiorani, F. and Schurr, U. (2013). Future scenarios for plant phenotyping. Annu Rev Plant Biol 64: 267-291.
- Granier, C., Aguirrezabal, L., Chenu, K., Cookson, S. J., Dauzat, M., Hamard, P., Thioux, J. J., Rolland, G., Bouchier-Combaud, S., Lebaudy, A., Muller, B., Simonneau, T. and Tardieu, F. (2006). PHENOPSIS, an automated platform for reproducible phenotyping of plant responses to soil water deficit in Arabidopsis thaliana permitted the identification of an accession with low sensitivity to soil water deficit. New Phytol 169(3): 623-635.
- Granier, C. and Vile, D. (2014). Phenotyping and beyond: modelling the relationships between traits. Curr Opin Plant Biol 18: 96-102.
- Rymaszewski, W., Vile, D., Bediee, A., Dauzat, M., Luchaire, N., Kamrowska, D., Granier, C. and Hennig, J. (2017). Stress-related gene expression reflects morphophysiological responses to water deficit. Plant Physiol 174(3): 1913-1930.
- Schneider, C. A., Rasband, W. S. and Eliceiri, K. W. (2012). NIH Image to ImageJ: 25 years of image analysis. Nat Methods 9(7): 671-675.
- Tisné, S., Schmalenbach, I., Reymond, M., Dauzat, M., Pervent, M., Vile, D. and Granier, C. (2010). Keep on growing under drought: genetic and developmental bases of the response of rosette area using a recombinant inbred line population. Plant Cell Environ 33(11): 1875-1887.
- Vile, D., Pervent, M., Belluau, M., Vasseur, F., Bresson, J., Muller, B., Granier, C. and Simonneau, T. (2012). Arabidopsis growth under prolonged high temperature and water deficit: independent or interactive effects? Plant Cell Environ 35(4): 702-718.
Article Information
Publication history
Accepted: Jan 26, 2018
Published: Feb 20, 2018
Copyright
© 2018 The Authors; exclusive licensee Bio-protocol LLC.
How to cite
Readers should cite both the Bio-protocol article and the original research article where this protocol was used:
- Rymaszewski, W., Dauzat, M., Bédiée, A., Rolland, G., Luchaire, N., Granier, C., Hennig, J. and Vile, D. (2018). Measurement of Arabidopsis thaliana Plant Traits Using the PHENOPSIS Phenotyping Platform. Bio-protocol 8(4): e2739. DOI: 10.21769/BioProtoc.2739.
- Rymaszewski, W., Vile, D., Bediee, A., Dauzat, M., Luchaire, N., Kamrowska, D., Granier, C. and Hennig, J. (2017). Stress-related gene expression reflects morphophysiological responses to water deficit. Plant Physiol 174(3): 1913-1930.
Category
Plant Science > Plant physiology > Plant growth
Plant Science > Plant physiology > Abiotic stress
Do you have any questions about this protocol?
Post your question to gather feedback from the community. We will also invite the authors of this article to respond.
![]() Tips for asking effective questions
Tips for asking effective questions
+ Description
Write a detailed description. Include all information that will help others answer your question including experimental processes, conditions, and relevant images.