
- Submit a Protocol
- Receive Our Alerts
- EN

- Protocols

- Articles and Issues
- For Authors
- About
- Become a Reviewer

Single-unit Recording in Awake Behaving Non-human Primates
Published: Vol 11, Iss 8, Apr 20, 2021 DOI: 10.21769/BioProtoc.3987 Views: 2525
Reviewed by: Atsushi NoritakeTomohiko TakeiAnonymous reviewer(s)
Original research article
The authors used this protocol in:
Jul 2020

Protocol Collections
Comprehensive collections of detailed, peer-reviewed protocols focusing on specific topics

Abstract
Non-human primates (NHPs) have been widely used as a species model in studies to understand higher brain functions in health and disease. These studies employ specifically designed behavioral tasks in which animal behavior is well-controlled, and record neuronal activity at high spatial and temporal resolutions while animals are performing the tasks. Here, we present a detailed procedure to conduct single-unit recording, which fulfils high spatial and temporal resolutions while macaque monkeys (i.e., widely used NHPs) perform behavioral tasks in a well-controlled manner. This procedure was used in our previous study to investigate the dynamics of neuronal activity during economic decision-making by the monkeys. Monkeys’ behavior was quantitated by eye position tracking and button press/release detection. By inserting a microelectrode into the brain, with a grid system in reference to magnetic resonance imaging, we precisely recorded the brain regions. Our experimental system permits rigorous investigation of the link between neuronal activity and behavior.
Keywords: Non-human primatesBackground
Non-human primates (NHPs) are widely used as a species model in medical and life science research since they are the phylogenetically closest animal species to humans among those used for invasive experiments. In the field of systems neuroscience, research using NHPs have provided fundamental knowledge regarding neural mechanisms underlying the higher brain functions that are substantially evolved in humans, such as visual processing (Dubner and Zeki, 1971; Hubel and Wiesel, 1968; Perrett et al., 1982), decision making (Shadlen and Newsome, 2001; Padoa-Schioppa and Assad, 2006), working memory (Funahashi et al., 1989; Miller et al., 1996), attention (Treue and Maunsell, 1996; Luck et al., 1997), meta-cognition (Middlebrooks and Sommer, 2012; Miyamoto et al., 2017), and sociality (Gallese et al., 1996; Noritake et al., 2018). NHP research has also shown abnormal neural activity patterns in specific brain regions of animal models for neurological and psychiatric disorders, which are potentially physiological mechanisms underlying these disorders (Langston et al., 1984; Jentsch et al., 1997). These investigations provide insight into “where” and “how” the brain should be treated, and have therefore served as a basis for the development of therapeutic approaches for these disorders.
A remarkable achievement of neuroscience research using NHPs has been to advance our understanding of the relationship between neuronal activity and animal behavior. These studies employ specifically designed, well-controlled behavioral tasks, and record neuronal activity at high spatial and temporal resolutions while animals perform the tasks. These behavioral tasks need to finely control sensory inputs, accurately monitor behavioral responses, and precisely determine the time of task events. Neuronal activity recording has been implemented using several procedures. among which single-unit recording has been widely used due to its high spatial and temporal resolutions. By coupling these behavioral and recording procedures, NHP research has demonstrated that neuronal activities are tightly linked to specific sensory inputs, behavioral responses, and presumed internal processes at the single-unit level since the 1960s (Evarts, 1966; Wurtz, 1968).
Most NHP neuroscience research has been carried out in macaque monkeys, although other NHPs such as marmosets and squirrel monkeys have also been utilized. Our research group has conducted single-unit recording during which macaque monkeys performed behavioral tasks (Matsumoto and Takada, 2013; Kawai et al., 2015; Ogasawara et al., 2018). Figure 1 shows an overview of the experimental setup that allows collection of neuronal and behavioral data simultaneously across a unified timeline. Recently, we used this experimental setup to study the neural mechanisms underlying economic decision-making. We conducted single-unit recording of midbrain dopamine neurons and the orbitofrontal cortex while macaque monkeys performed an economic decision-making task (Figure 2A). In this task, six visual objects were associated with different amounts of a liquid reward, and two of them were randomly offered in sequence. When the first object was presented, the monkey needed to decide either to choose the first object by releasing the button or wait for the upcoming second object by continuing to press the button. The monkey obtained the reward associated with the chosen object at the end of the trial (Yun et al., 2020). This task design enabled us to continuously monitor neuronal activity while decisions were being made during the presentation of the first object, that is, as the monkey evaluated the first object, decided whether to choose it, and expressed the choice by releasing the button. We demonstrated that, while macaque monkeys were making an economic decision, midbrain dopamine neurons exhibited dynamically changing signals related to internal processing, such as value evaluation and identification of a chosen option (Yun et al., 2020). Here, we introduce the detailed experimental procedure used in this original study.
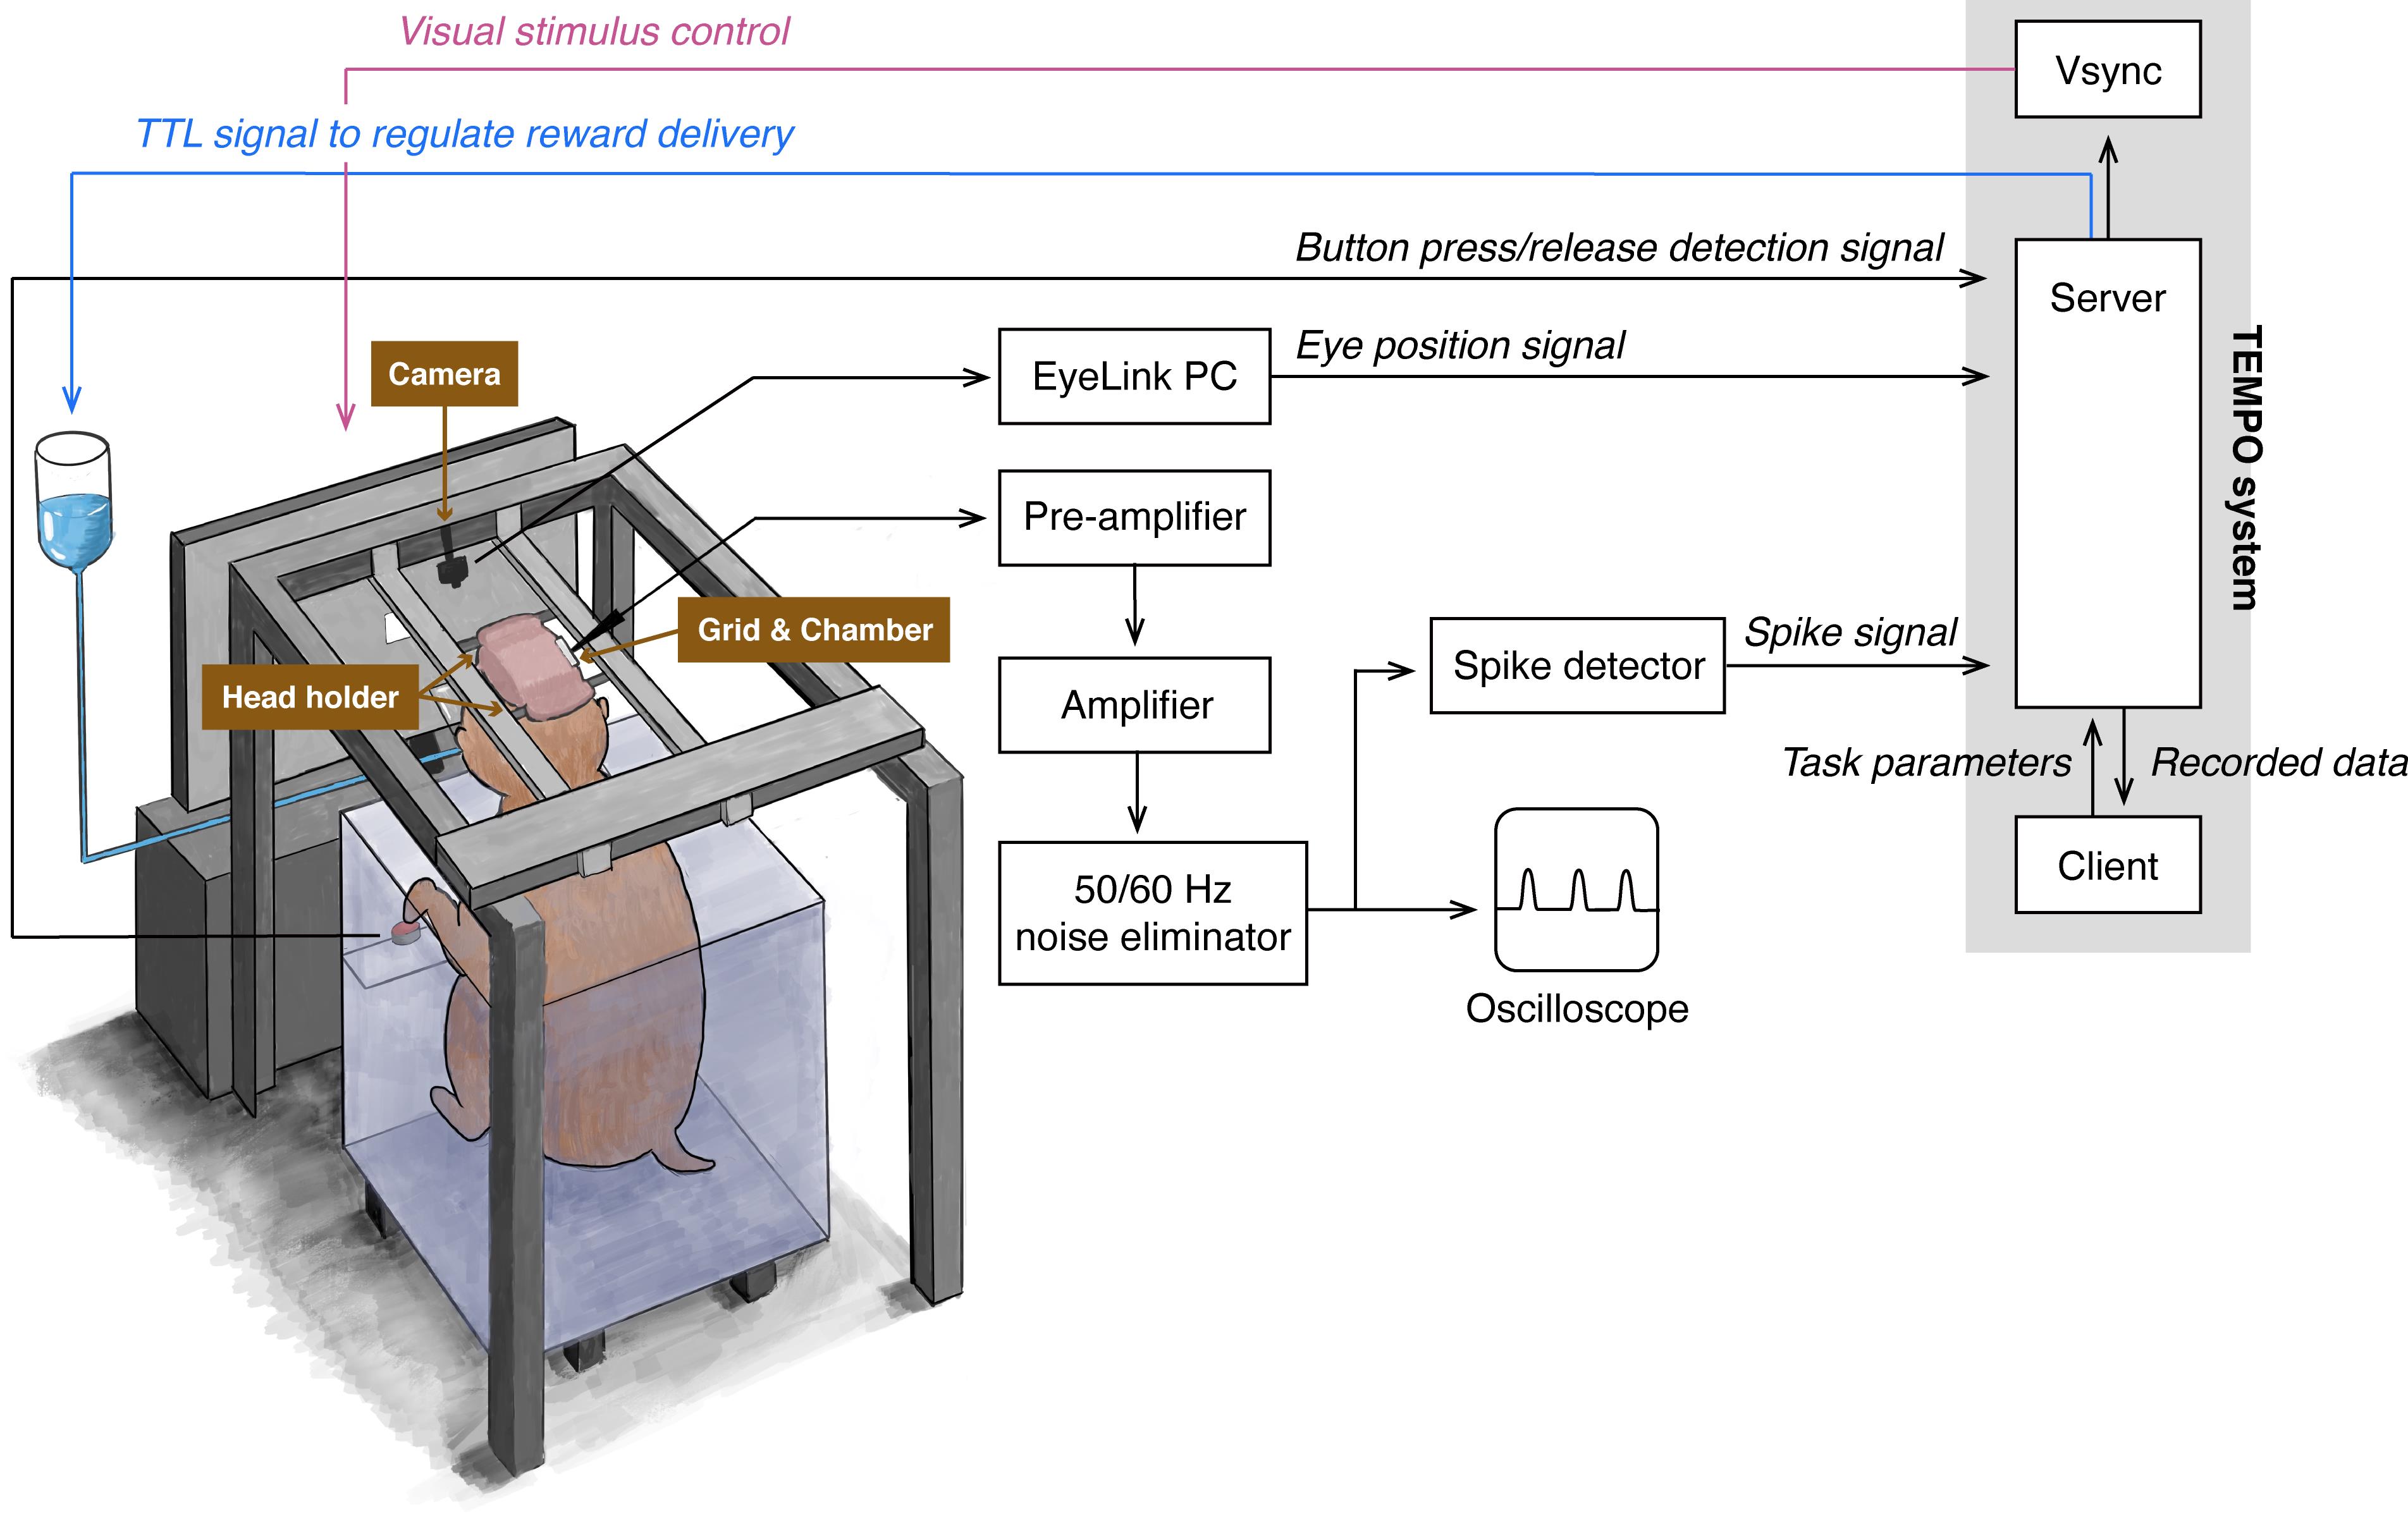
Figure 1. Schematic illustration of the entire behavioral and neuronal recording system.This illustration shows the configurations of apparatuses, how behavioral and neuronal data are collected by the TEMPO experimental control system, and how this system controls task events. The TEMPO experimental control system consists of three computers: Vsync, Server, and Client.
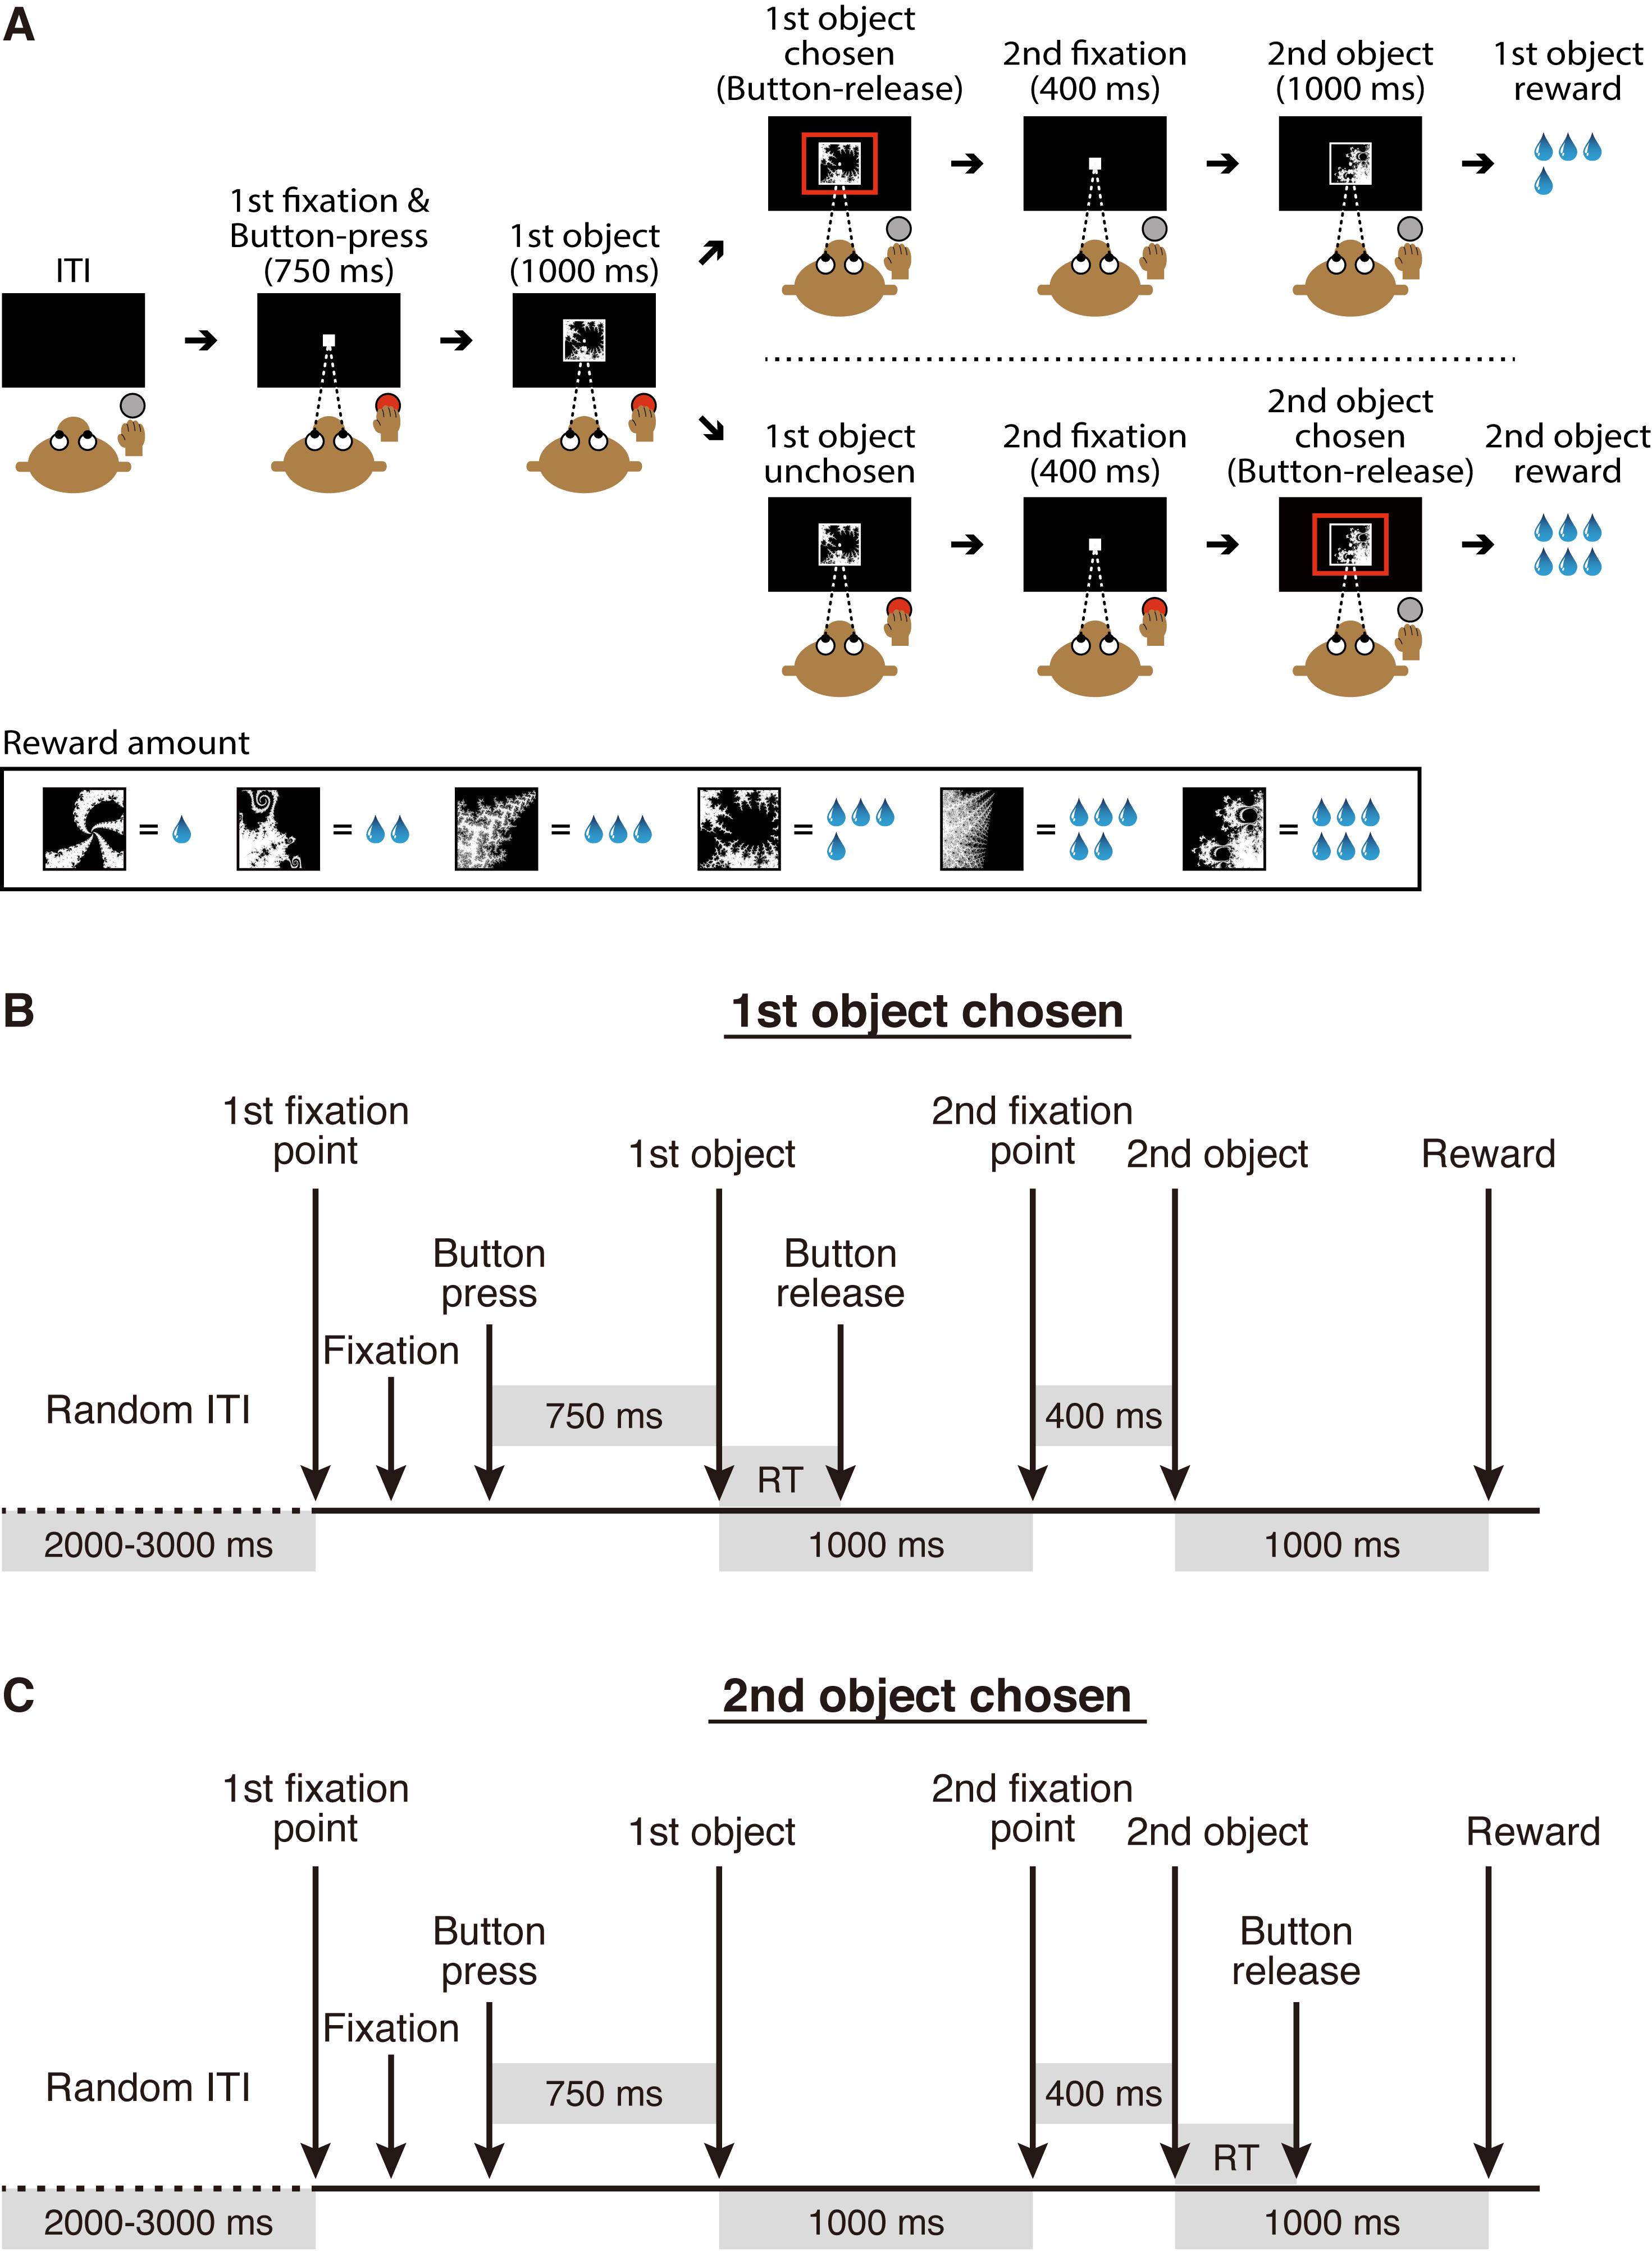
Figure 2. Economic decision-making task. A. Task design. This figure was reproduced with permission from our original paper (Yun et al., 2020. Figure 1A). B and C. The sequence of task events for trials in which a monkey decides to choose the first object or (B) the second object (C). ITI, intertrial interval; RT, choice reaction time.
Materials and Reagents
Materials
Recording chamber (Isekyu, custom-made, see Figure 3)
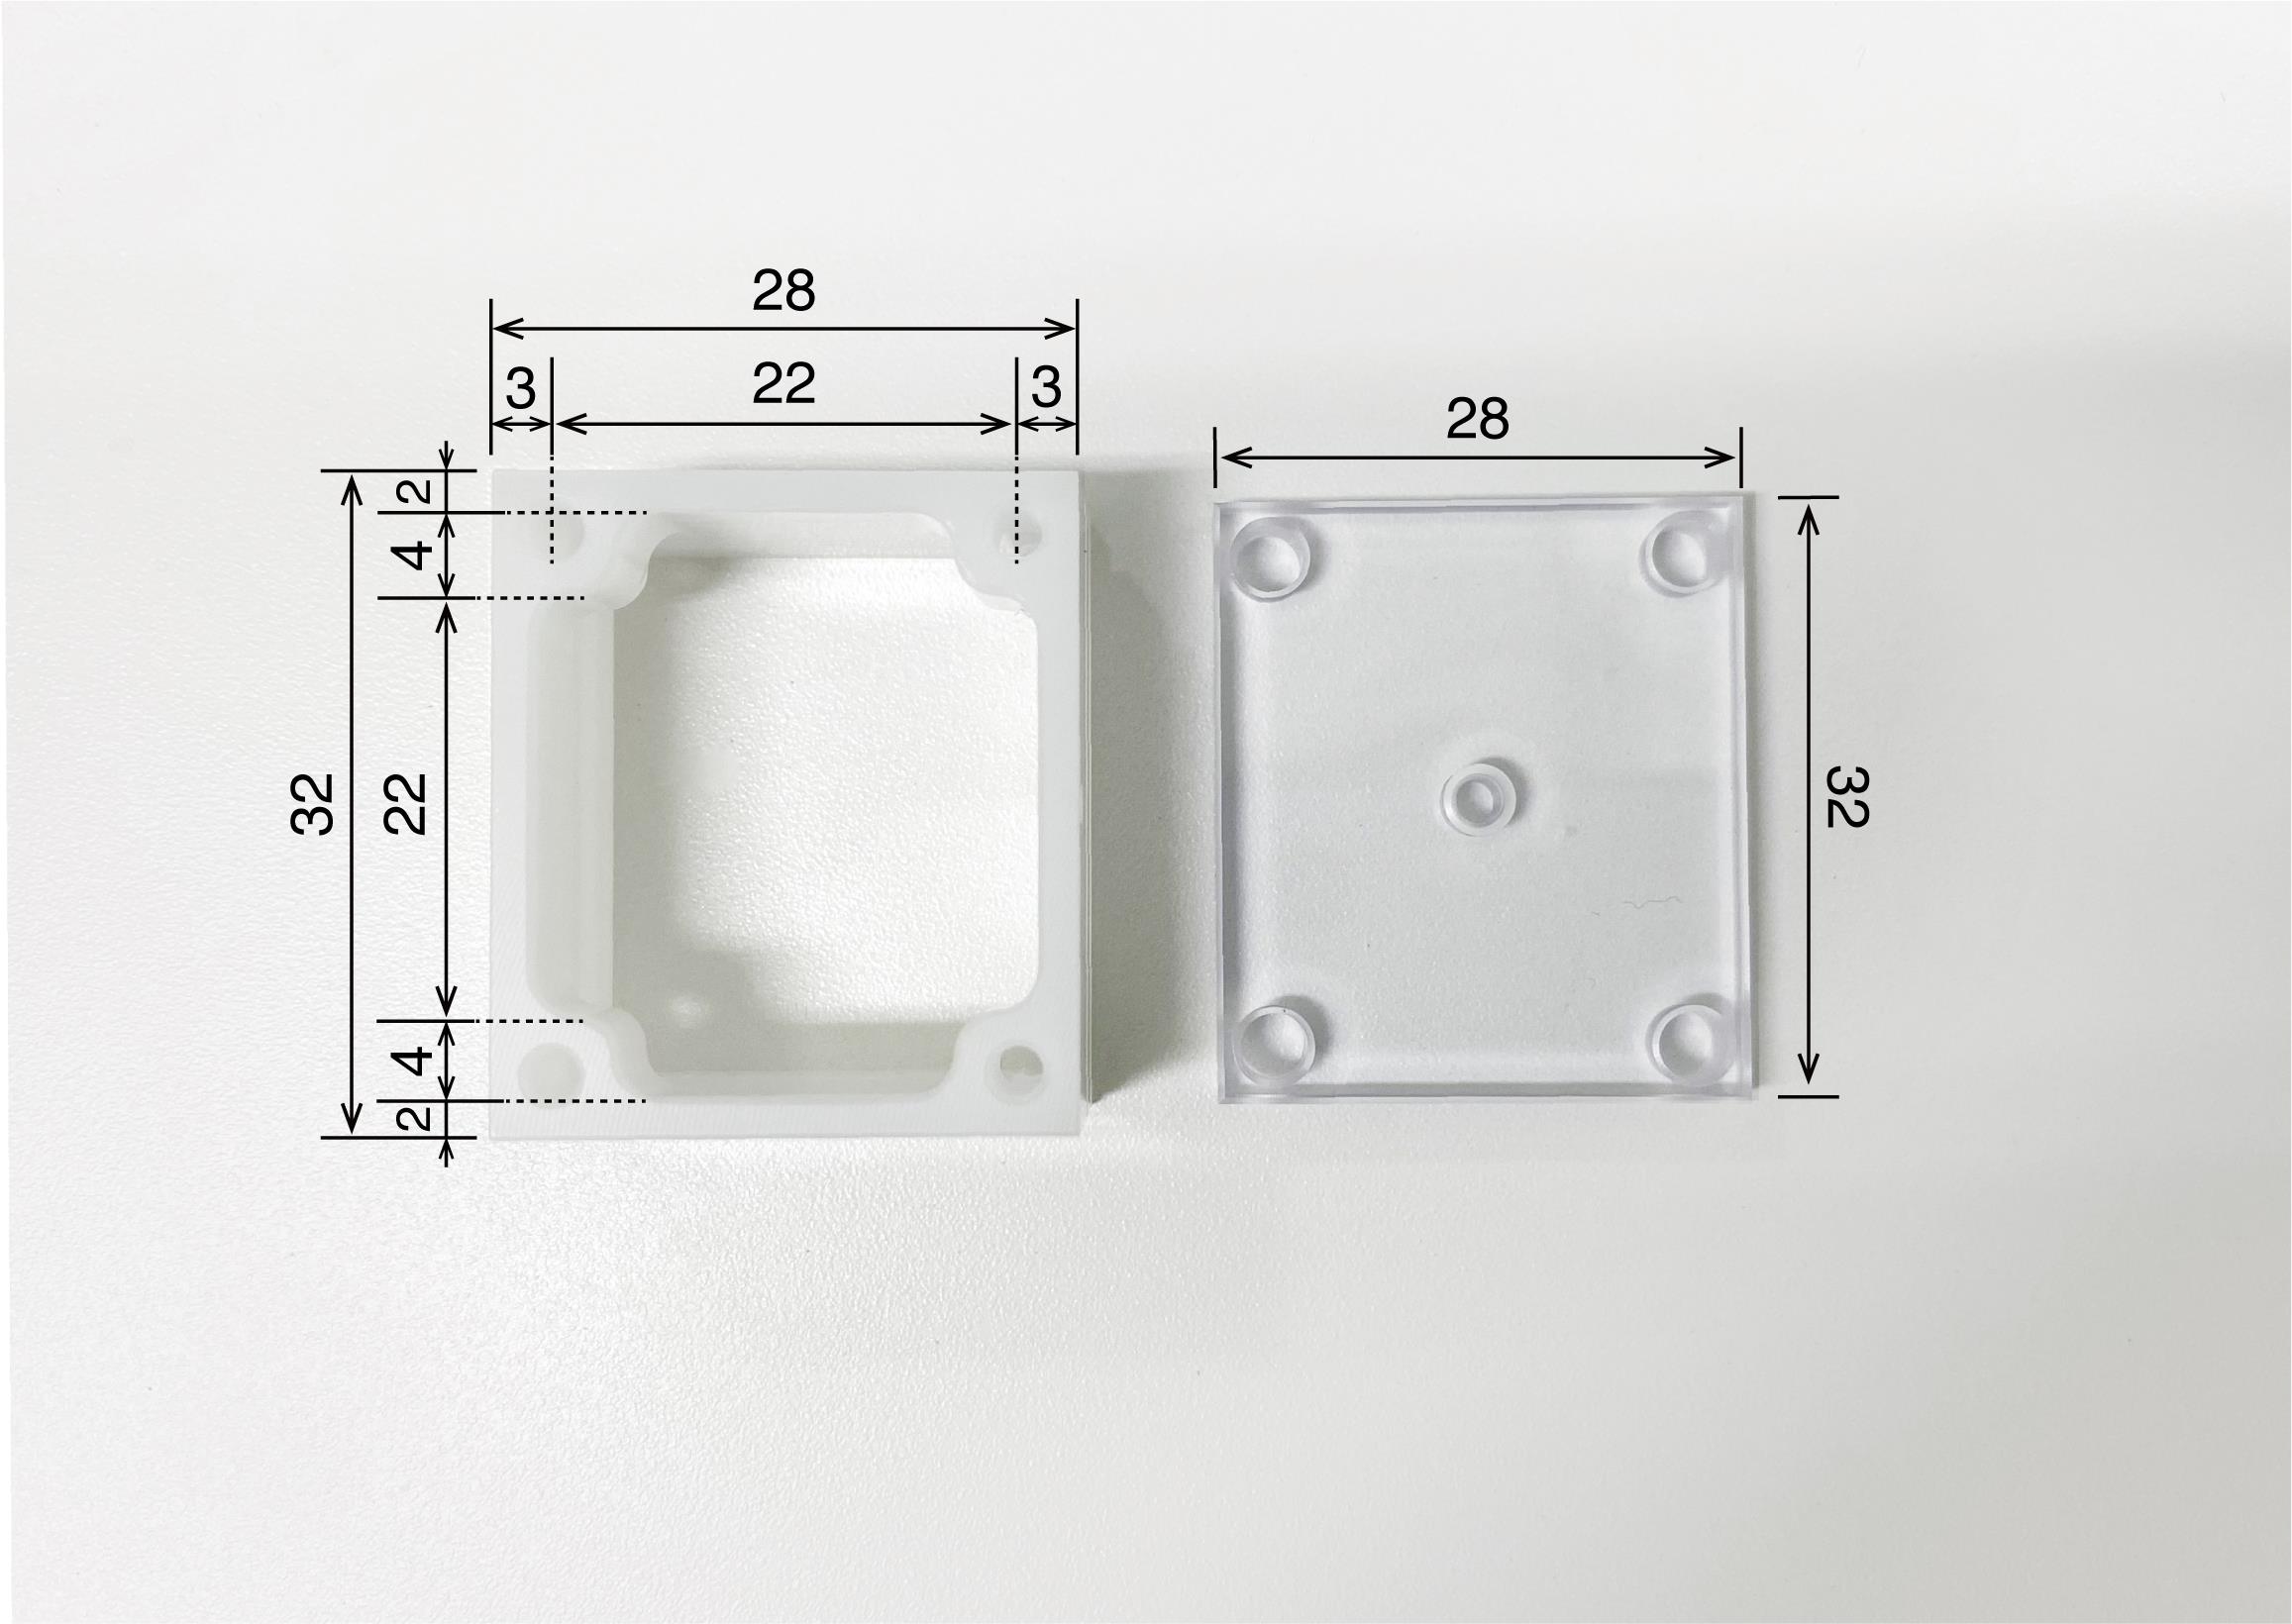
Figure 3. Recording chamber. Recording chamber (left) and its cover (right). The camber is made of polyoxymethylene and the cover is made of acrylic. The numbers written in the figure refer to millimeters as the unit.Recording grid (Isekyu, custom-made; see Figure 4)
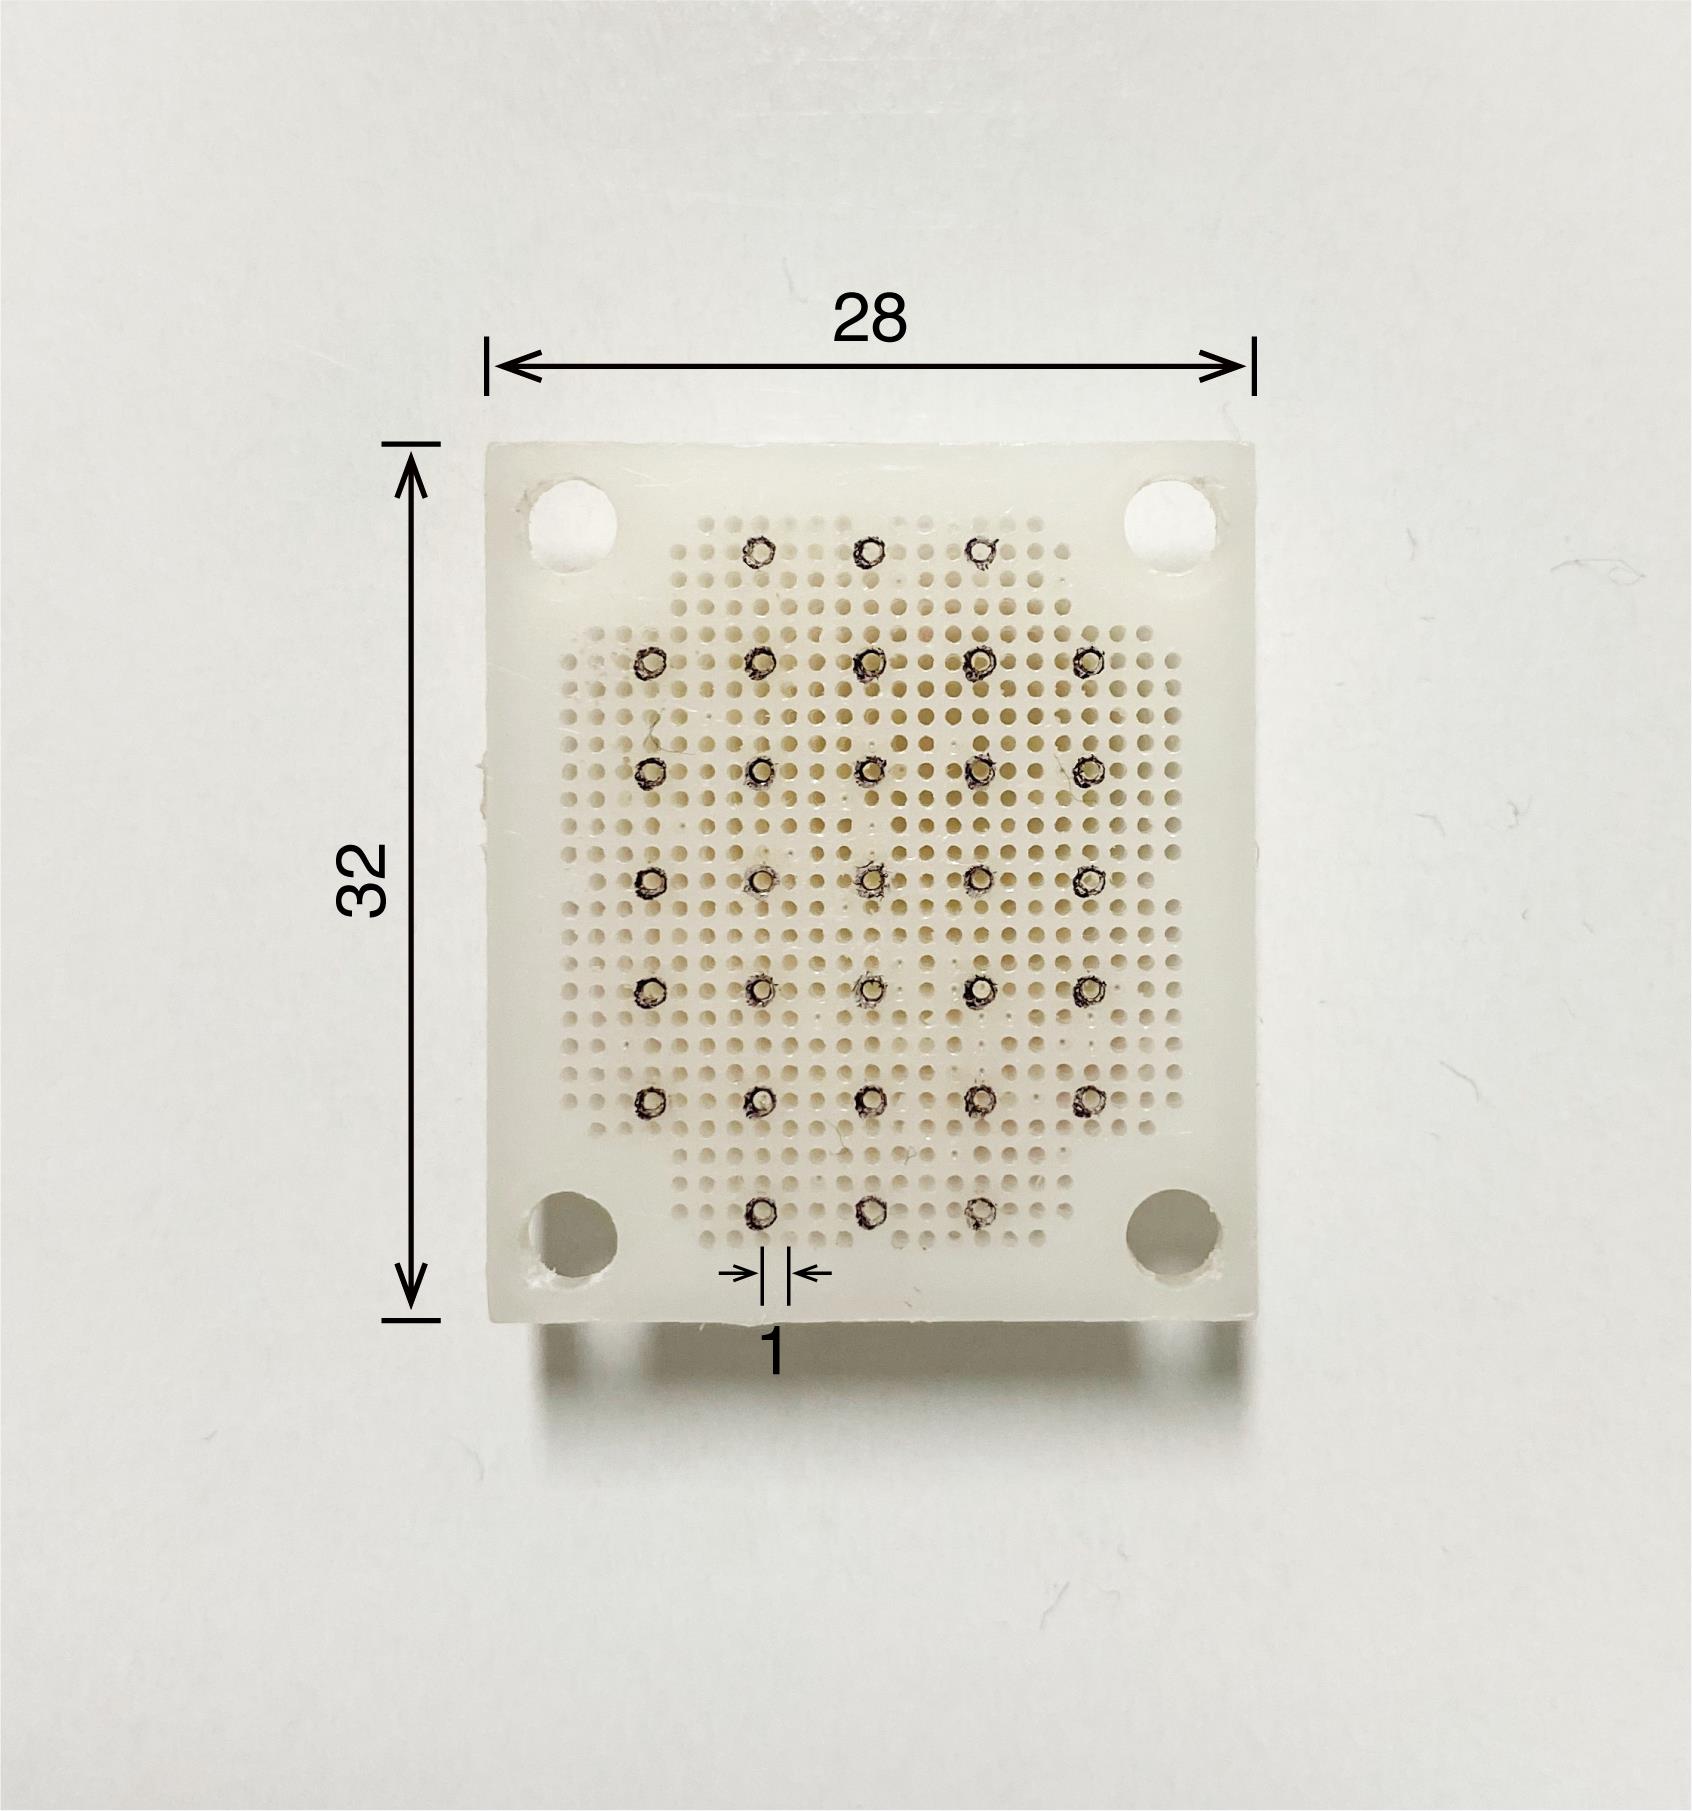
Figure 4. Recording grid. The grid is made of polyoxymethylene and needs to fit exactly in the recording chamber to accurately determine the position of microelectrode penetration. The numbers written in the figure refer to millimeters as the unit.Cortical screw (Wilco, catalog number: RY-0306; see Figure 5)
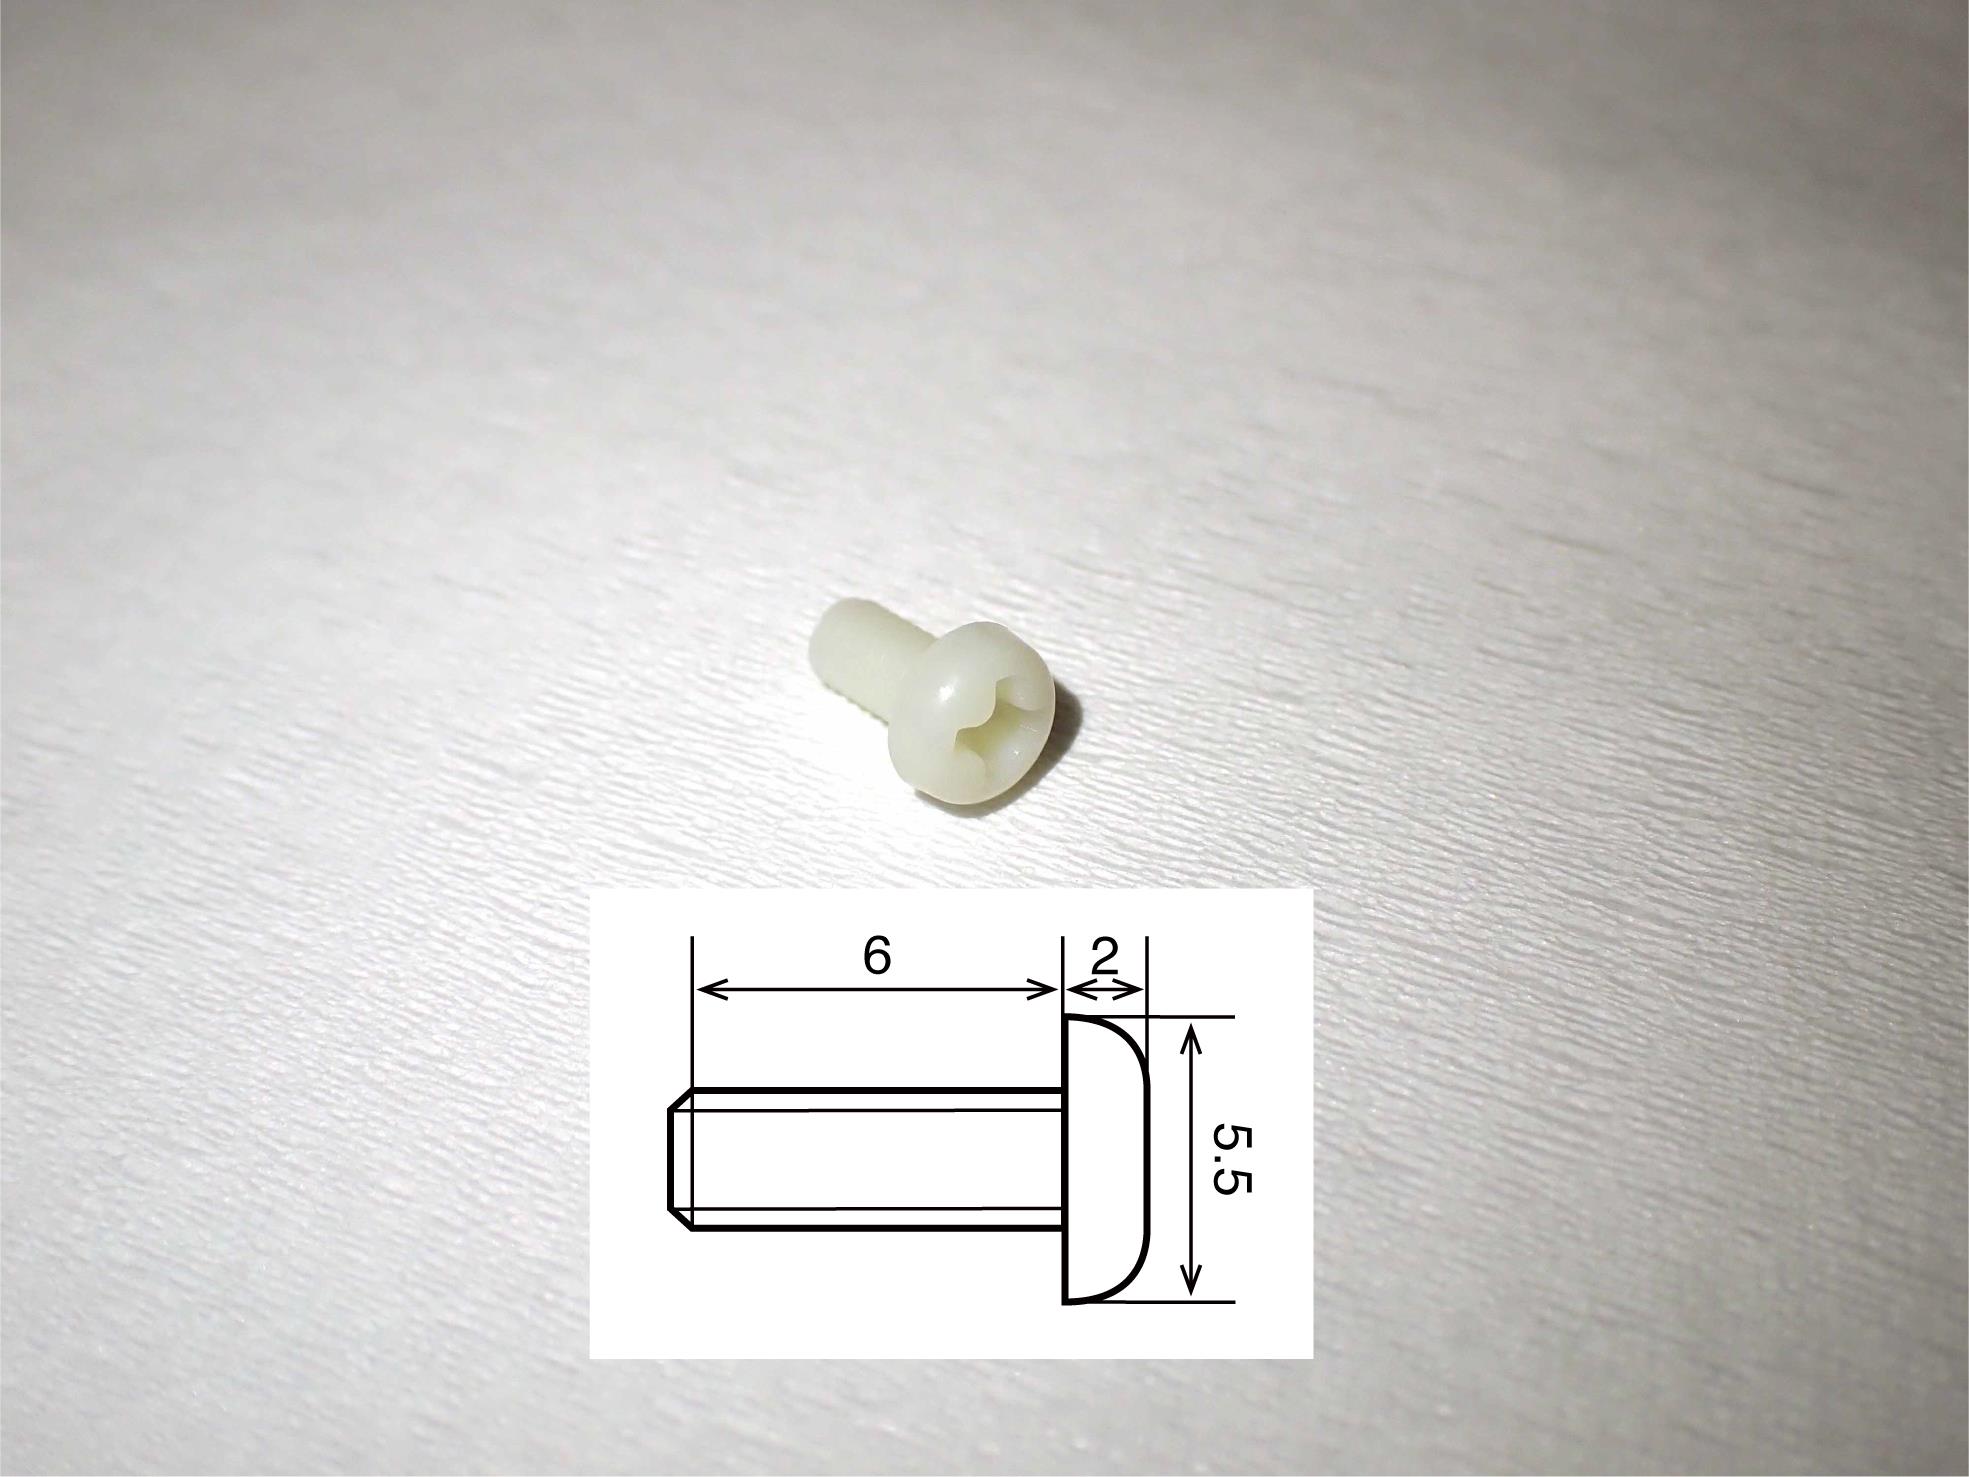
Figure 5. Cortical screw. The screw is made of polyamide MXD6, which is the main compound in reny. The schematic insert shows details of the size. The numbers written in the figure refer to millimeters as the unit.Head holder (Bioresearch Center, catalog number: CP1007-0031P-3, see Figure 6)
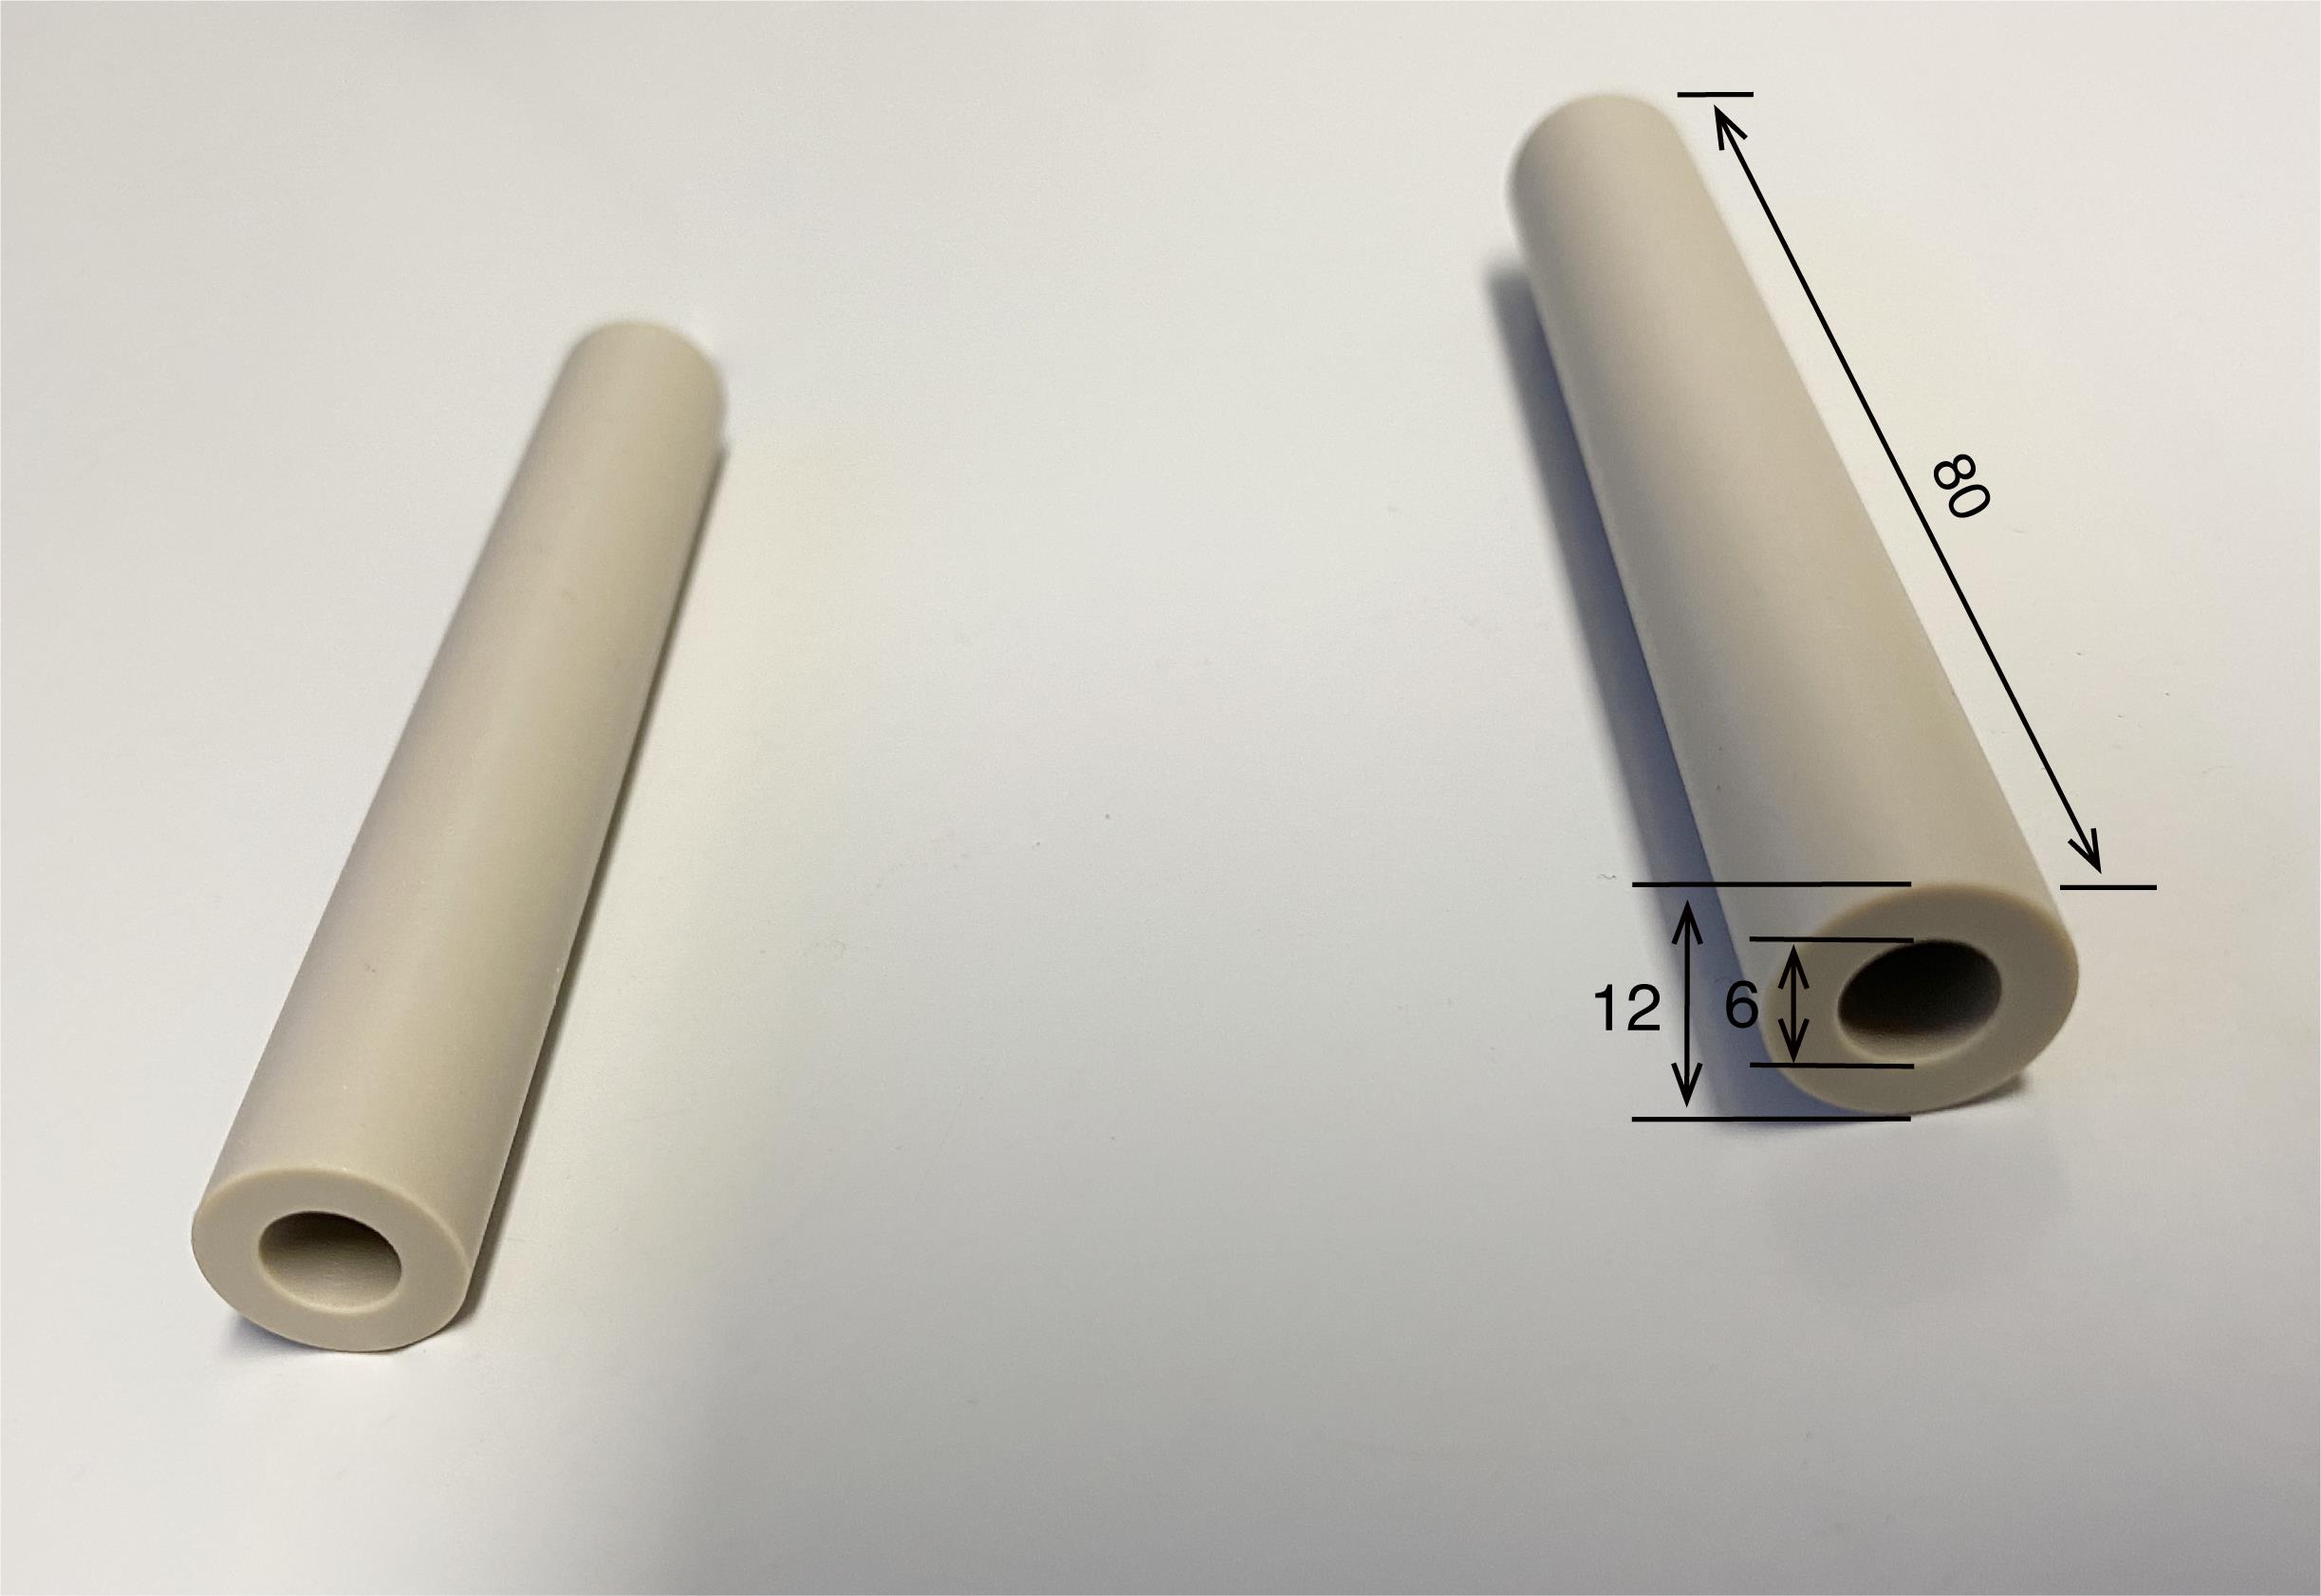
Figure 6. Head holder. Two of the cylinders are embedded in dental acrylic resin, which covers the top of the monkey’s skull. The two cylinders are configured in parallel. The cylinder is made of peek. The numbers written in the figure refer to millimeters as the unit.
Animals
Rhesus monkeys (Macaca mulatta)
Reagents
Saline (Otsuka Pharmaceutical, catalog number: 9F84S)
Chlorhexidine (Rapotec) (Nikko Pharmaceutical, catalog number: 872619)
Ethanol (FUJIFILM Wako Chemical, catalog number: ESL2739)
Povidone iodine (Popyral) (Nikko Pharmaceutical, catalog number: 2612701Q3407)
Ketamin (Ketalar) (Daiichi Sankyo Propharma, catalog number: 1119400A2038)
Pentobarbital sodium (Somnopentyl) (Kyoritsu Seiyaku, catalog number: SOM03-ON1706)
Xylazine (Seractal) (Bayer Medical, catalog number: 4987341106720)
Cefazolin sodium (Sefmazon) (Nipro Pharmaceutical, catalog number: 876132)
Buprenorphine hydrochloride (Lepetan) (Otsuka Pharmaceutical, catalog number: 31641-1)
Atropine sulfate hydrate (Nipro Pharmaceutical, catalog number: 1242405A1011)
Dental acrylic resin (Repairsin) (GC, catalog number: 20300BZZ00570000)
Ointment (CHLOMY-P) (Alfresa Pharmaceutical, catalog number: EAR2224)
Equipment
Battery-operated impedance meter (World Precision Instruments, model: OMEGAZ)
Binocular biological microscope (Beijing Tech Instrument, catalog number: 0702-327)
Tungsten microelectrode (FHC, catalog number: UEWLEESEEN1E)
Stainless-steel guide tube (original design, see Figure 7)
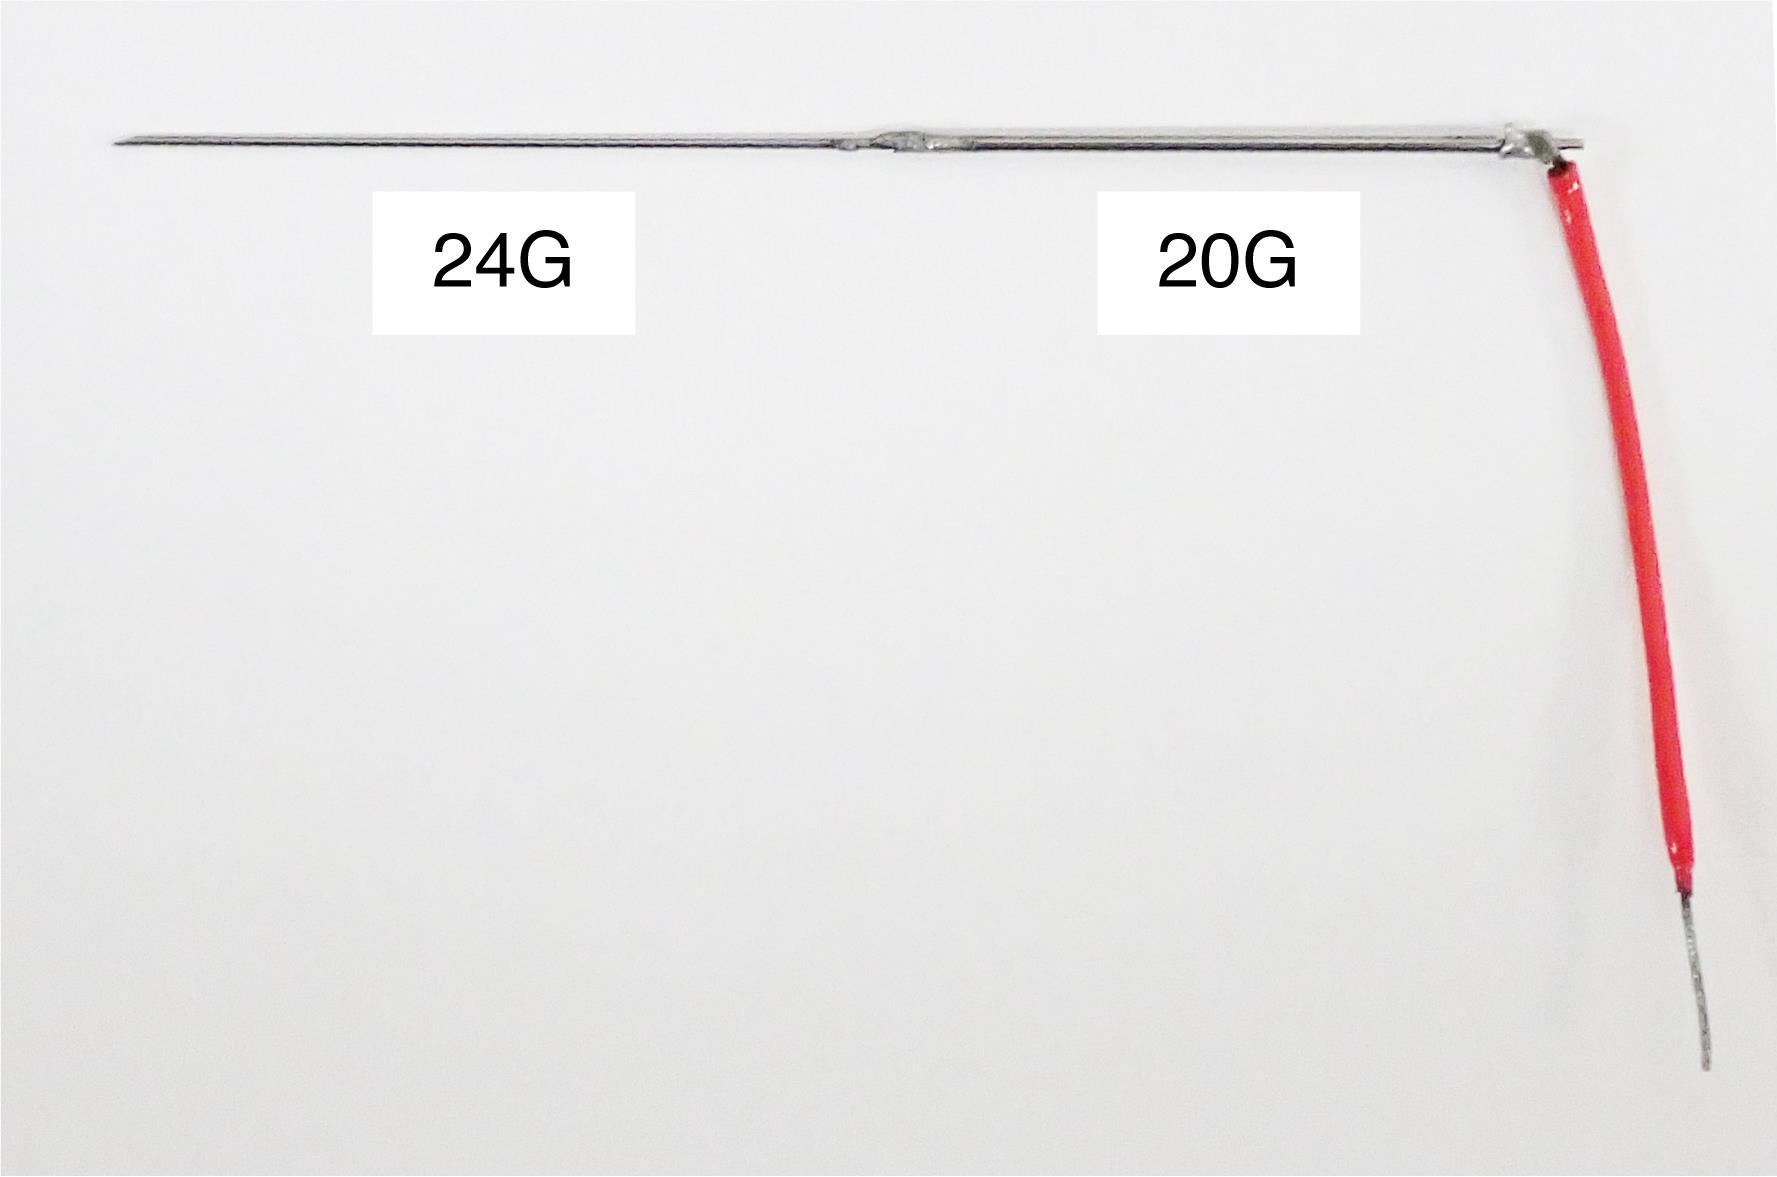
Figure 7. Stainless-steel guide tube. The guide tube is used to guide a microelectrode into the brain via the dura. It is made of stainless-steel tubes of two gage sizes (20G and 24G). The 24G part is inserted into the brain and the 20G part is firmly attached to an oil-driven micromanipulator (see Figure 12). The length of each part is adjusted according to the depth of the recording site. The red wire is connected to the minus pole of the pre-amplifier of the multi-channel processor.Uninterruptible power supply (APC, catalog number: 0L1039)
Oscilloscope (HITACHI, catalog number: V-250)
Multi-channel processor (Alpha Omega, model: MCP-Plus 8)
Voltage–time window discrimination system (Alpha Omega, model: ASD)
Reward system (Crist Instrument, model: 5-RLD-E2)
50/60 Hz noise eliminator (Quest Scientific Instruments, model: HumBug HB5060HZ)
Infrared eye tracking system (SR Research, model: EyeLink1000 Primate)
Computer monitor (Dell, model: P2412Hb)
Oil-driven micromanipulator (Narishige Scientific Instrument Lab, catalog number: MO-97-S)
Hand-driven micromanipulator (KOPF Instruments, catalog number: 7456B)
Monkey chair with a button (O’hara, catalog number: MC-3404MS; see Figure 8)
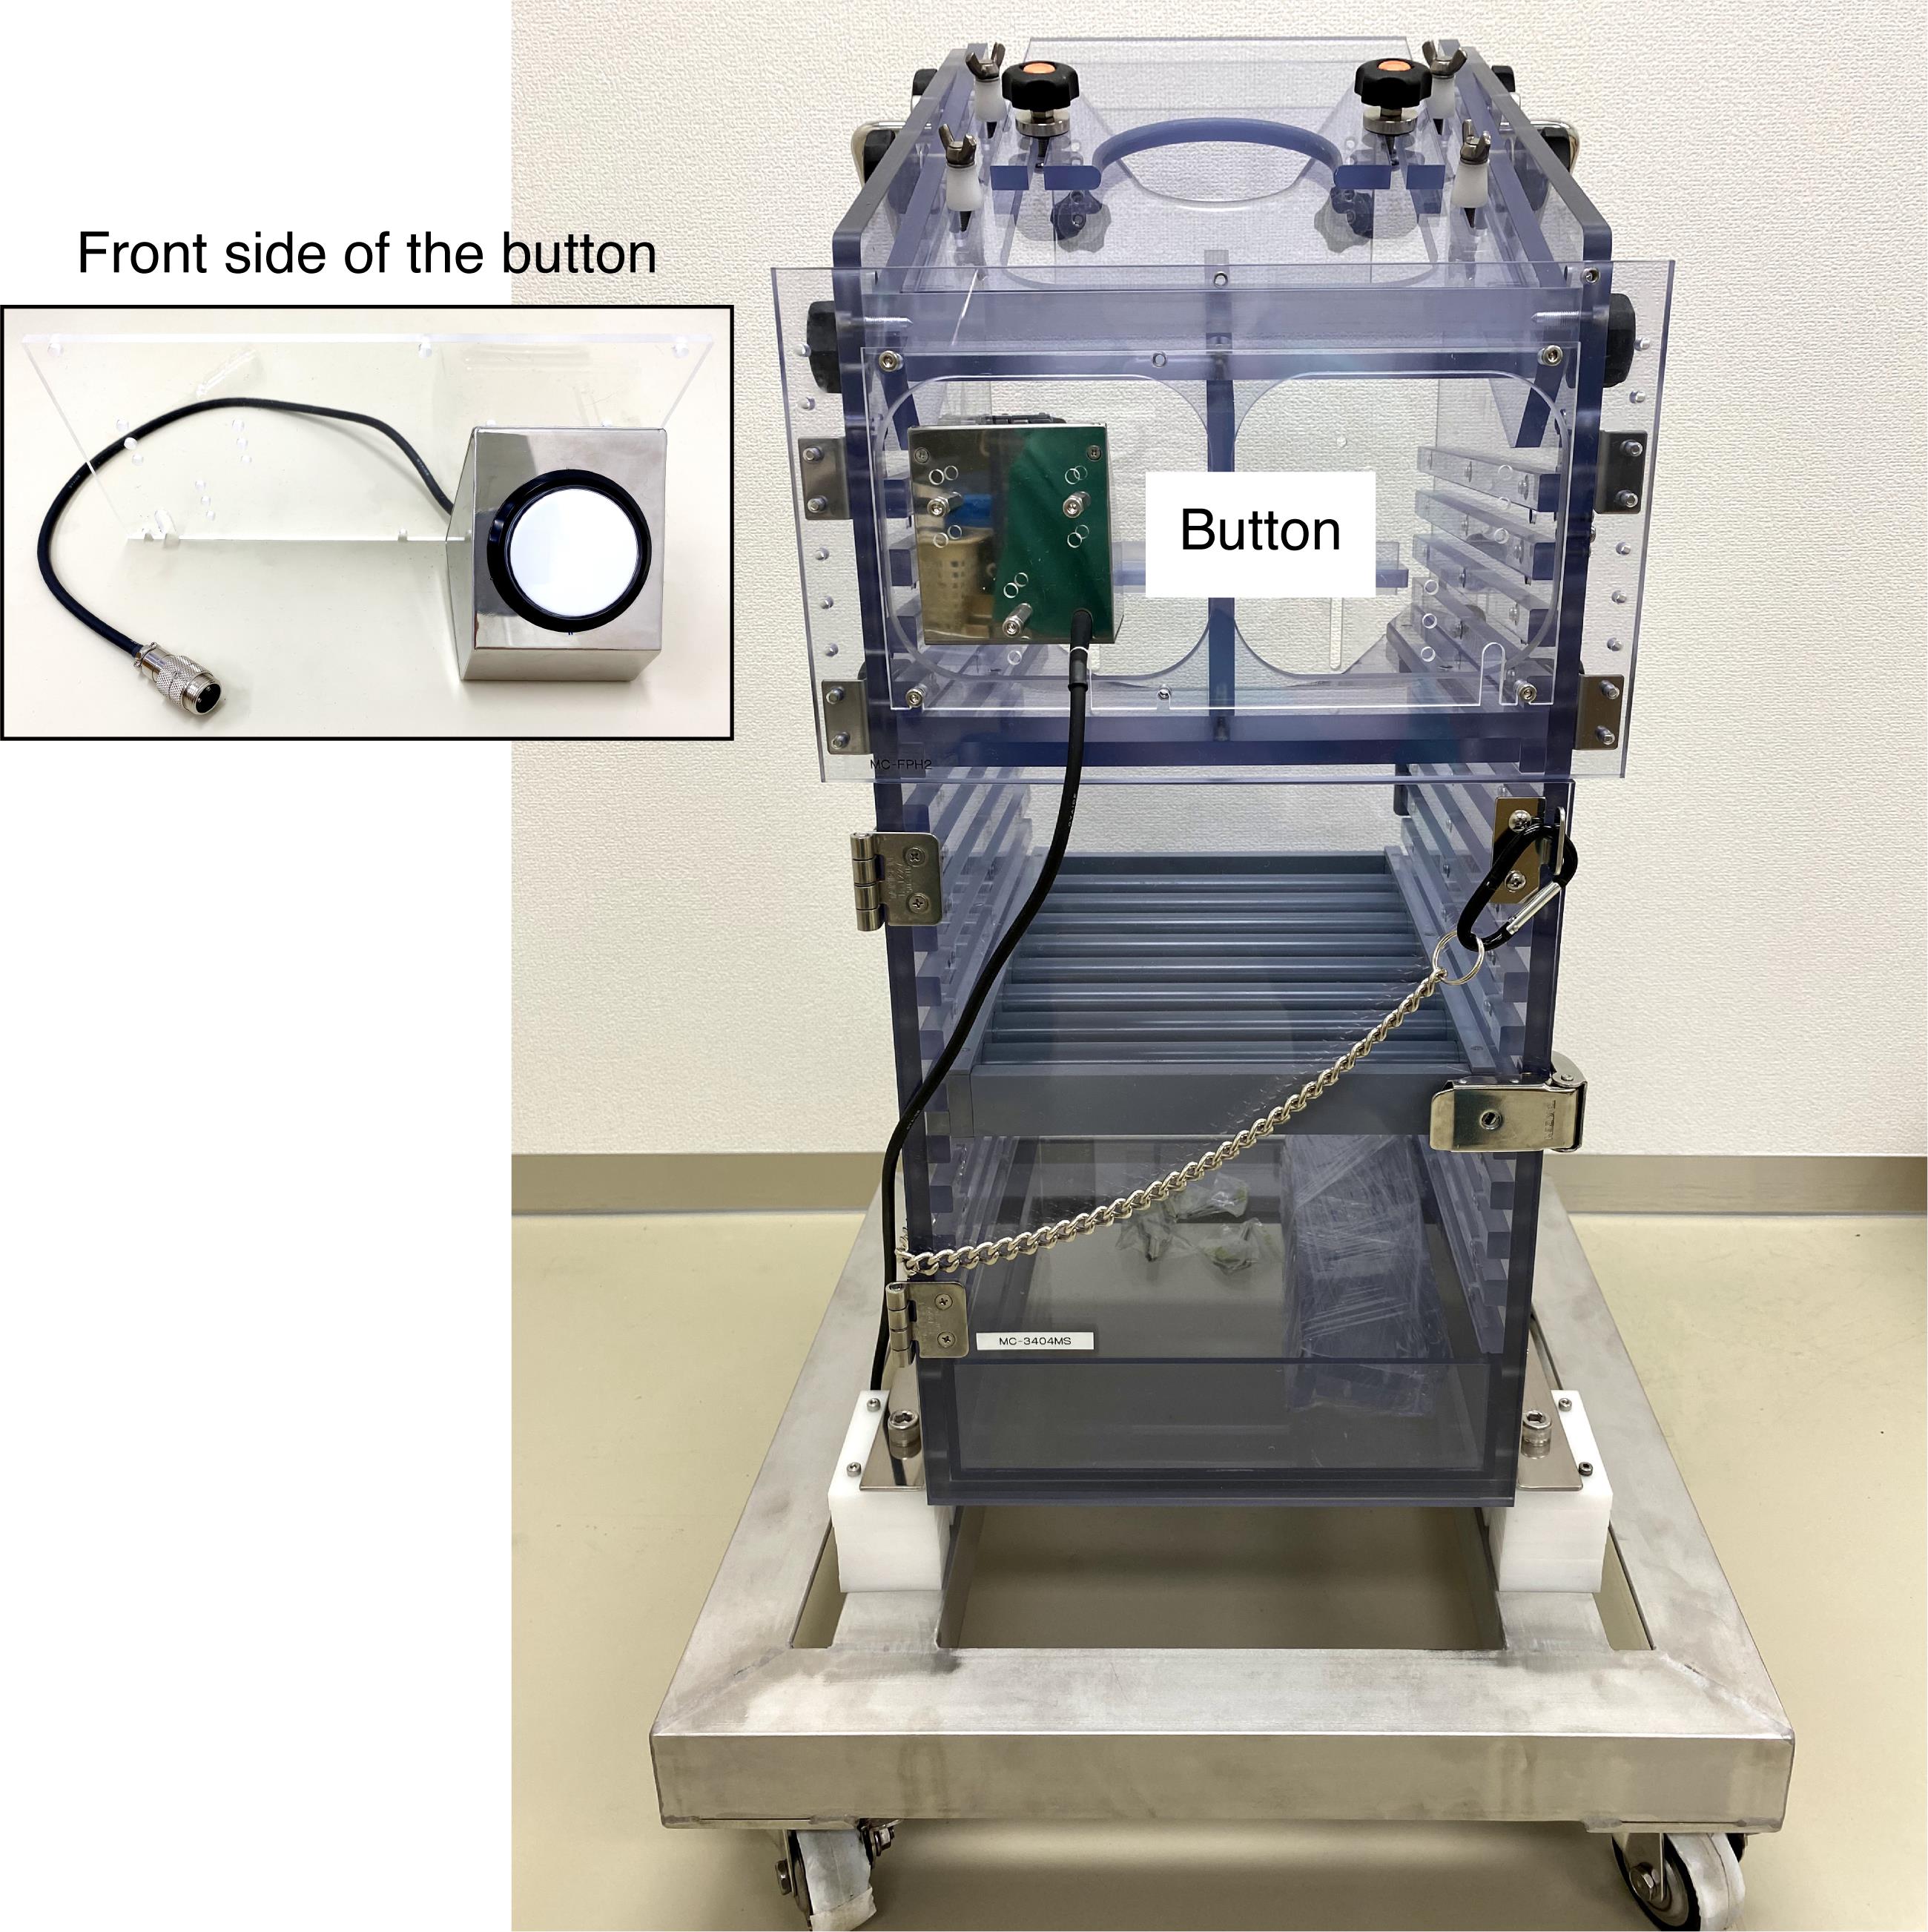
Figure 8. Monkey chair with a button. The image insert shows the front side of the button.Sound-attenuated and electrically shielded room (O’hara, custom-made)
Steel frame (O’hara, custom-made, modelr: MC-BFCS; see Figure 9)
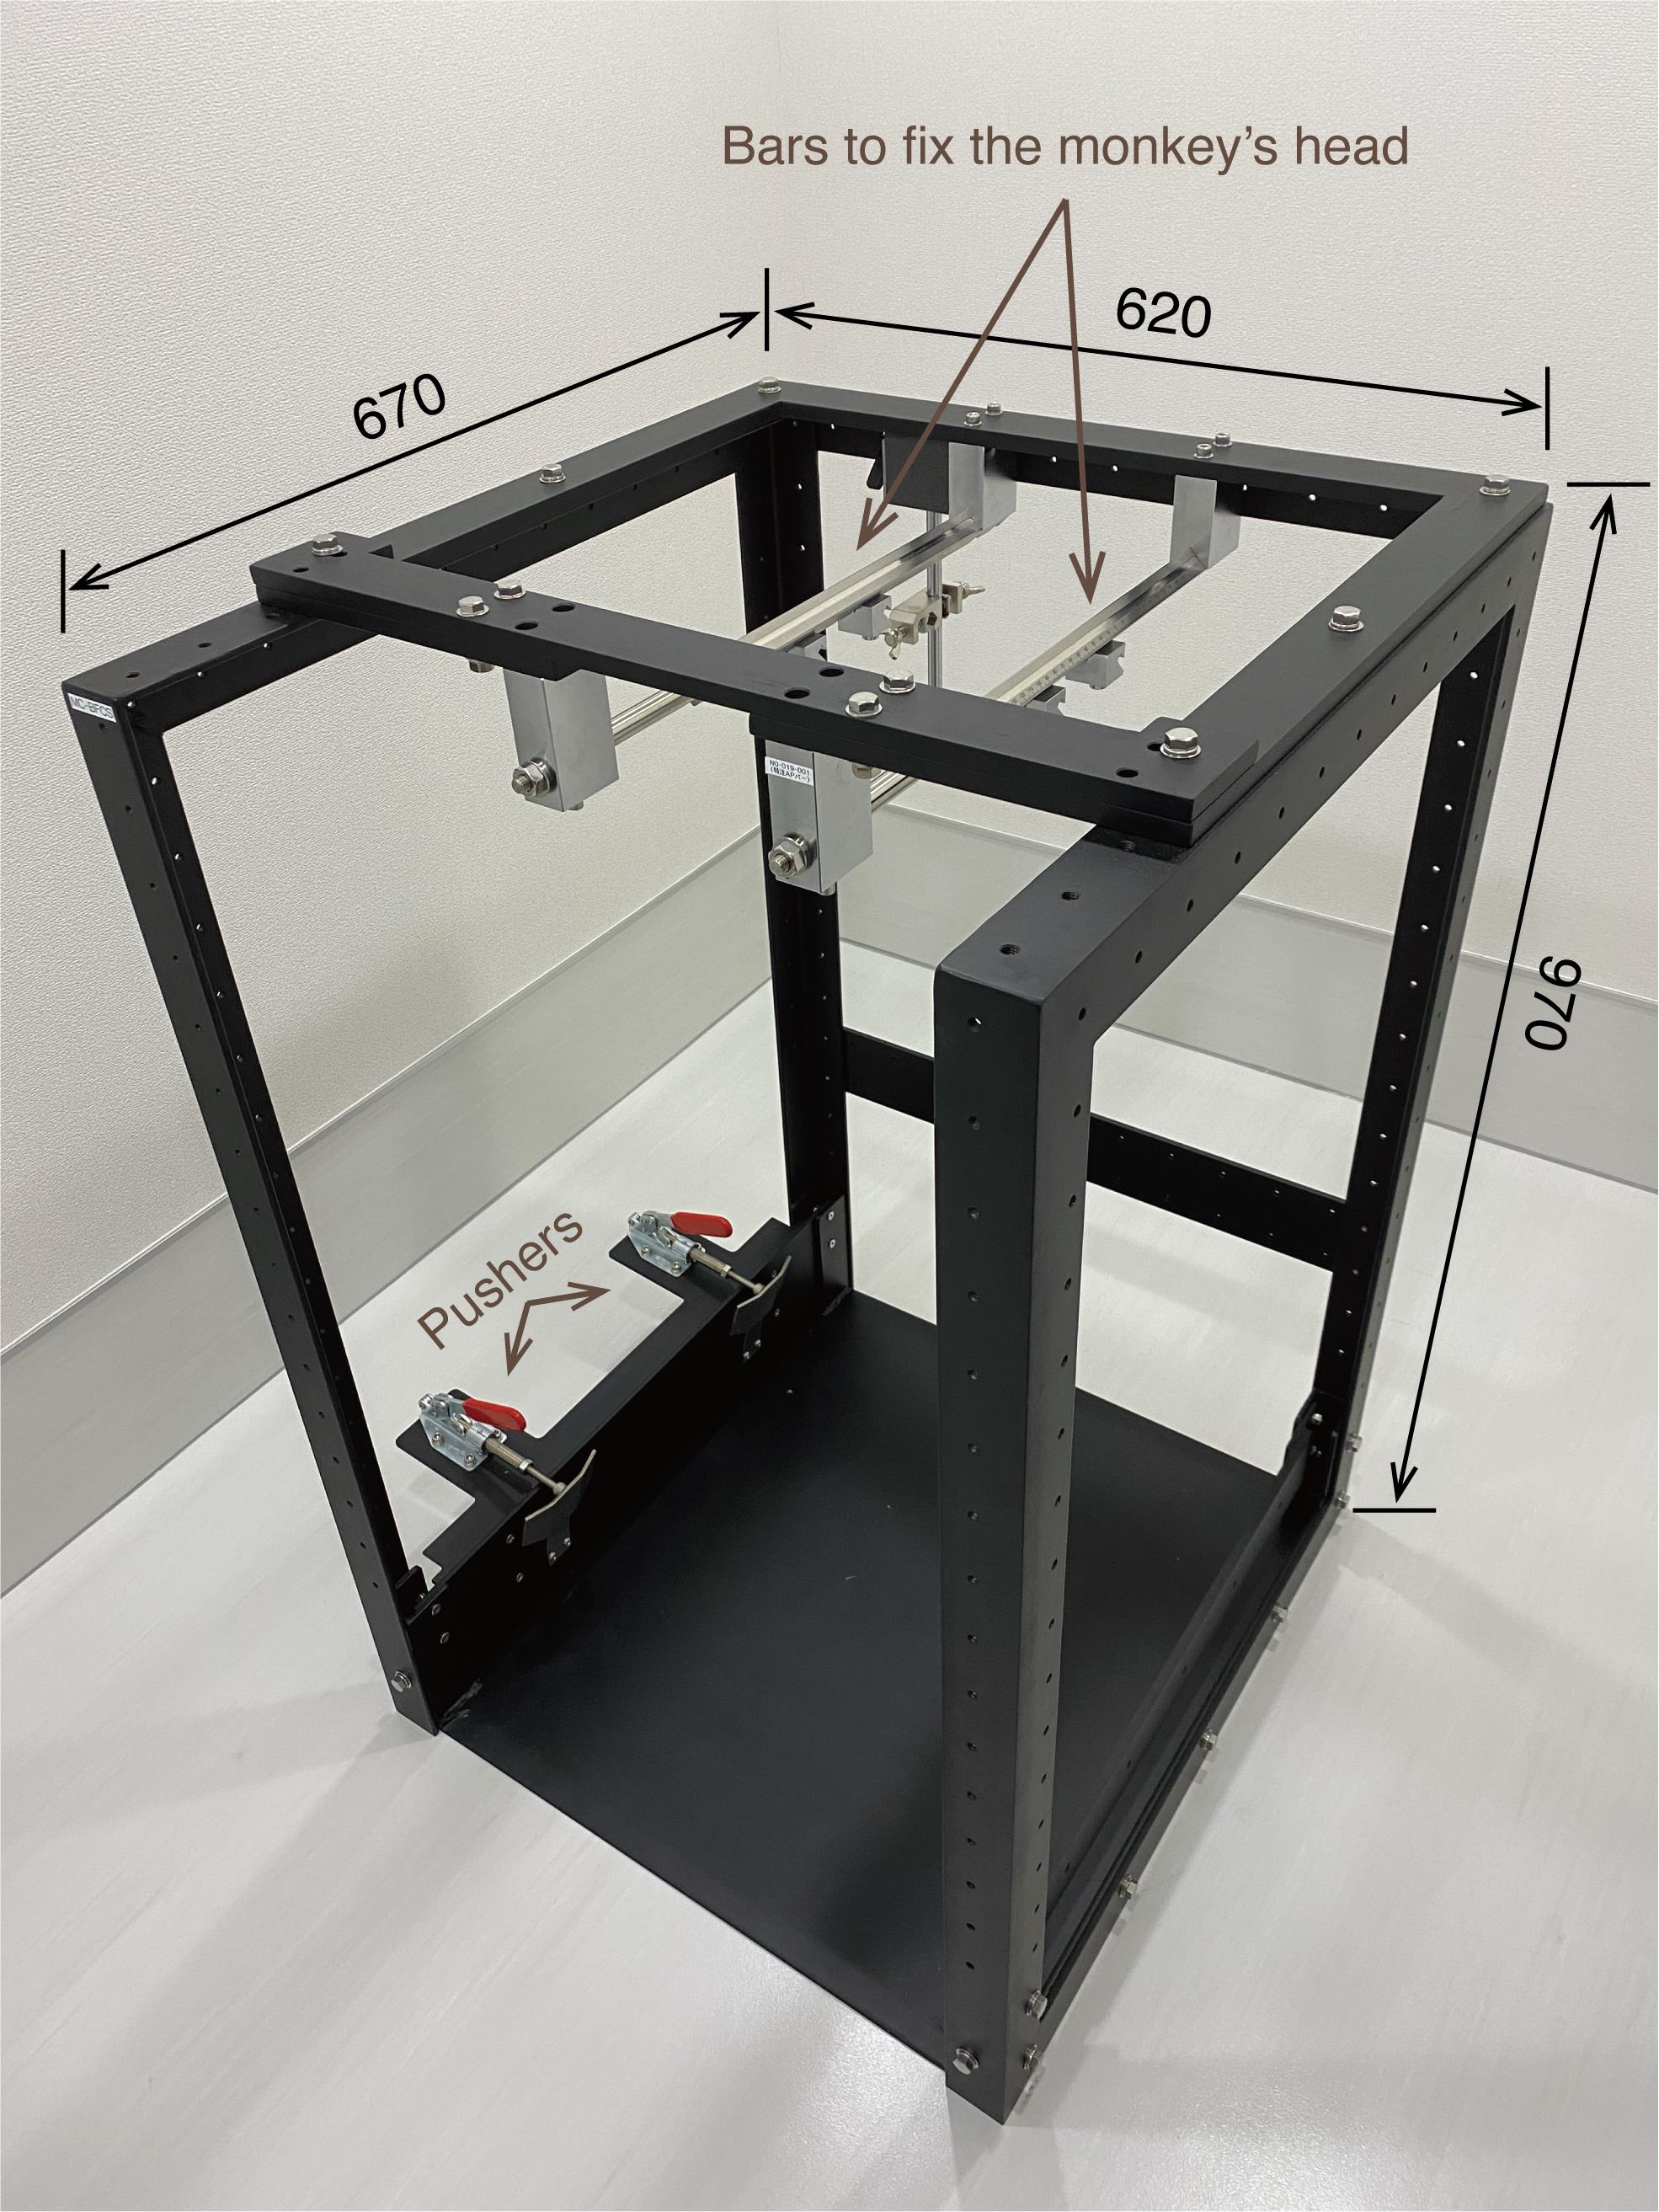
Figure 9. Steel frame. The monkey chair is firmly anchored by the two pushers. The monkey’s head is fixed to the two bars attached to the top of the steel frame. The computer monitor is placed in front of the steel frame (not shown here). The numbers written in the figure refer to millimeters as the unit.
Software
Multi-channel processor (MCP) ver 3.73 (ALPHA OMEGA, www.alphaomega-eng.com)
Alpha spike detector (ASD) (ALPHA OMEGA, www.alphaomega-eng.com)
TEMPO experimental control system (Reflective Computing, http://reflectivecomputing.com)
EyeLink (SR Research, http://sr-research.jp)
Matlab (Mathworks, http://mathworks.com)
Procedure
Surgery
To fix the plastic head holder (Figure 6) and recording chambers (Figure 3) to the monkey’s skull, surgery is performed under general anesthesia and sterile conditions.
Monkeys are anesthetized by intravascular injection of ketamine HCI (10 mg/kg) and xylazine (1–2 mg/kg) with atropine sulfate hydrate (0.02 mg/kg), and are maintained under general anesthesia by intravascular injection of pentobarbital sodium (25 mg/kg). Buprenorphine hydrochloride (0.01 mg/kg) is given as an analgesic.
The head holder and recording chambers are embedded in dental acrylic resin, which covers the top of the skull and is firmly anchored to the skull by plastic cortical screws (Figure 5).
A part of the skull inside the recording chamber is removed to introduce a microelectrode into the brain via the dura.
After the surgery, the monkeys are administered cefazolin sodium (20 mg/kg/day) and buprenorphine hydrochloride (0.01 mg/kg) for one week to avoid infection and pain, respectively. The monkeys are allowed to recover for more than 14 days after surgery. Experiments are started only after the monkeys have completely recovered.
The inside of the chamber is cleaned daily with povidone iodine solution and sterilized saline.
The chamber is covered when single-unit recording or cleaning is not being conducted.
Behavioral task
A monkey sits in a monkey chair (Figure 8) facing a computer monitor in a sound-attenuated and electrically shielded room.
The monkey chair is placed inside a steel frame (Figure 9), and the monkey’s head is fixed to two bars attached to the top of the steel frame (see Figure 1 for the configurations of the monkey, monkey chair, steel frame, and computer monitor).
A hot mirror is placed in front of the monkey’s eyes at an appropriate angle, such that an infrared camera attached above can capture a reflected image of the monkey’s pupils (Figure 10).
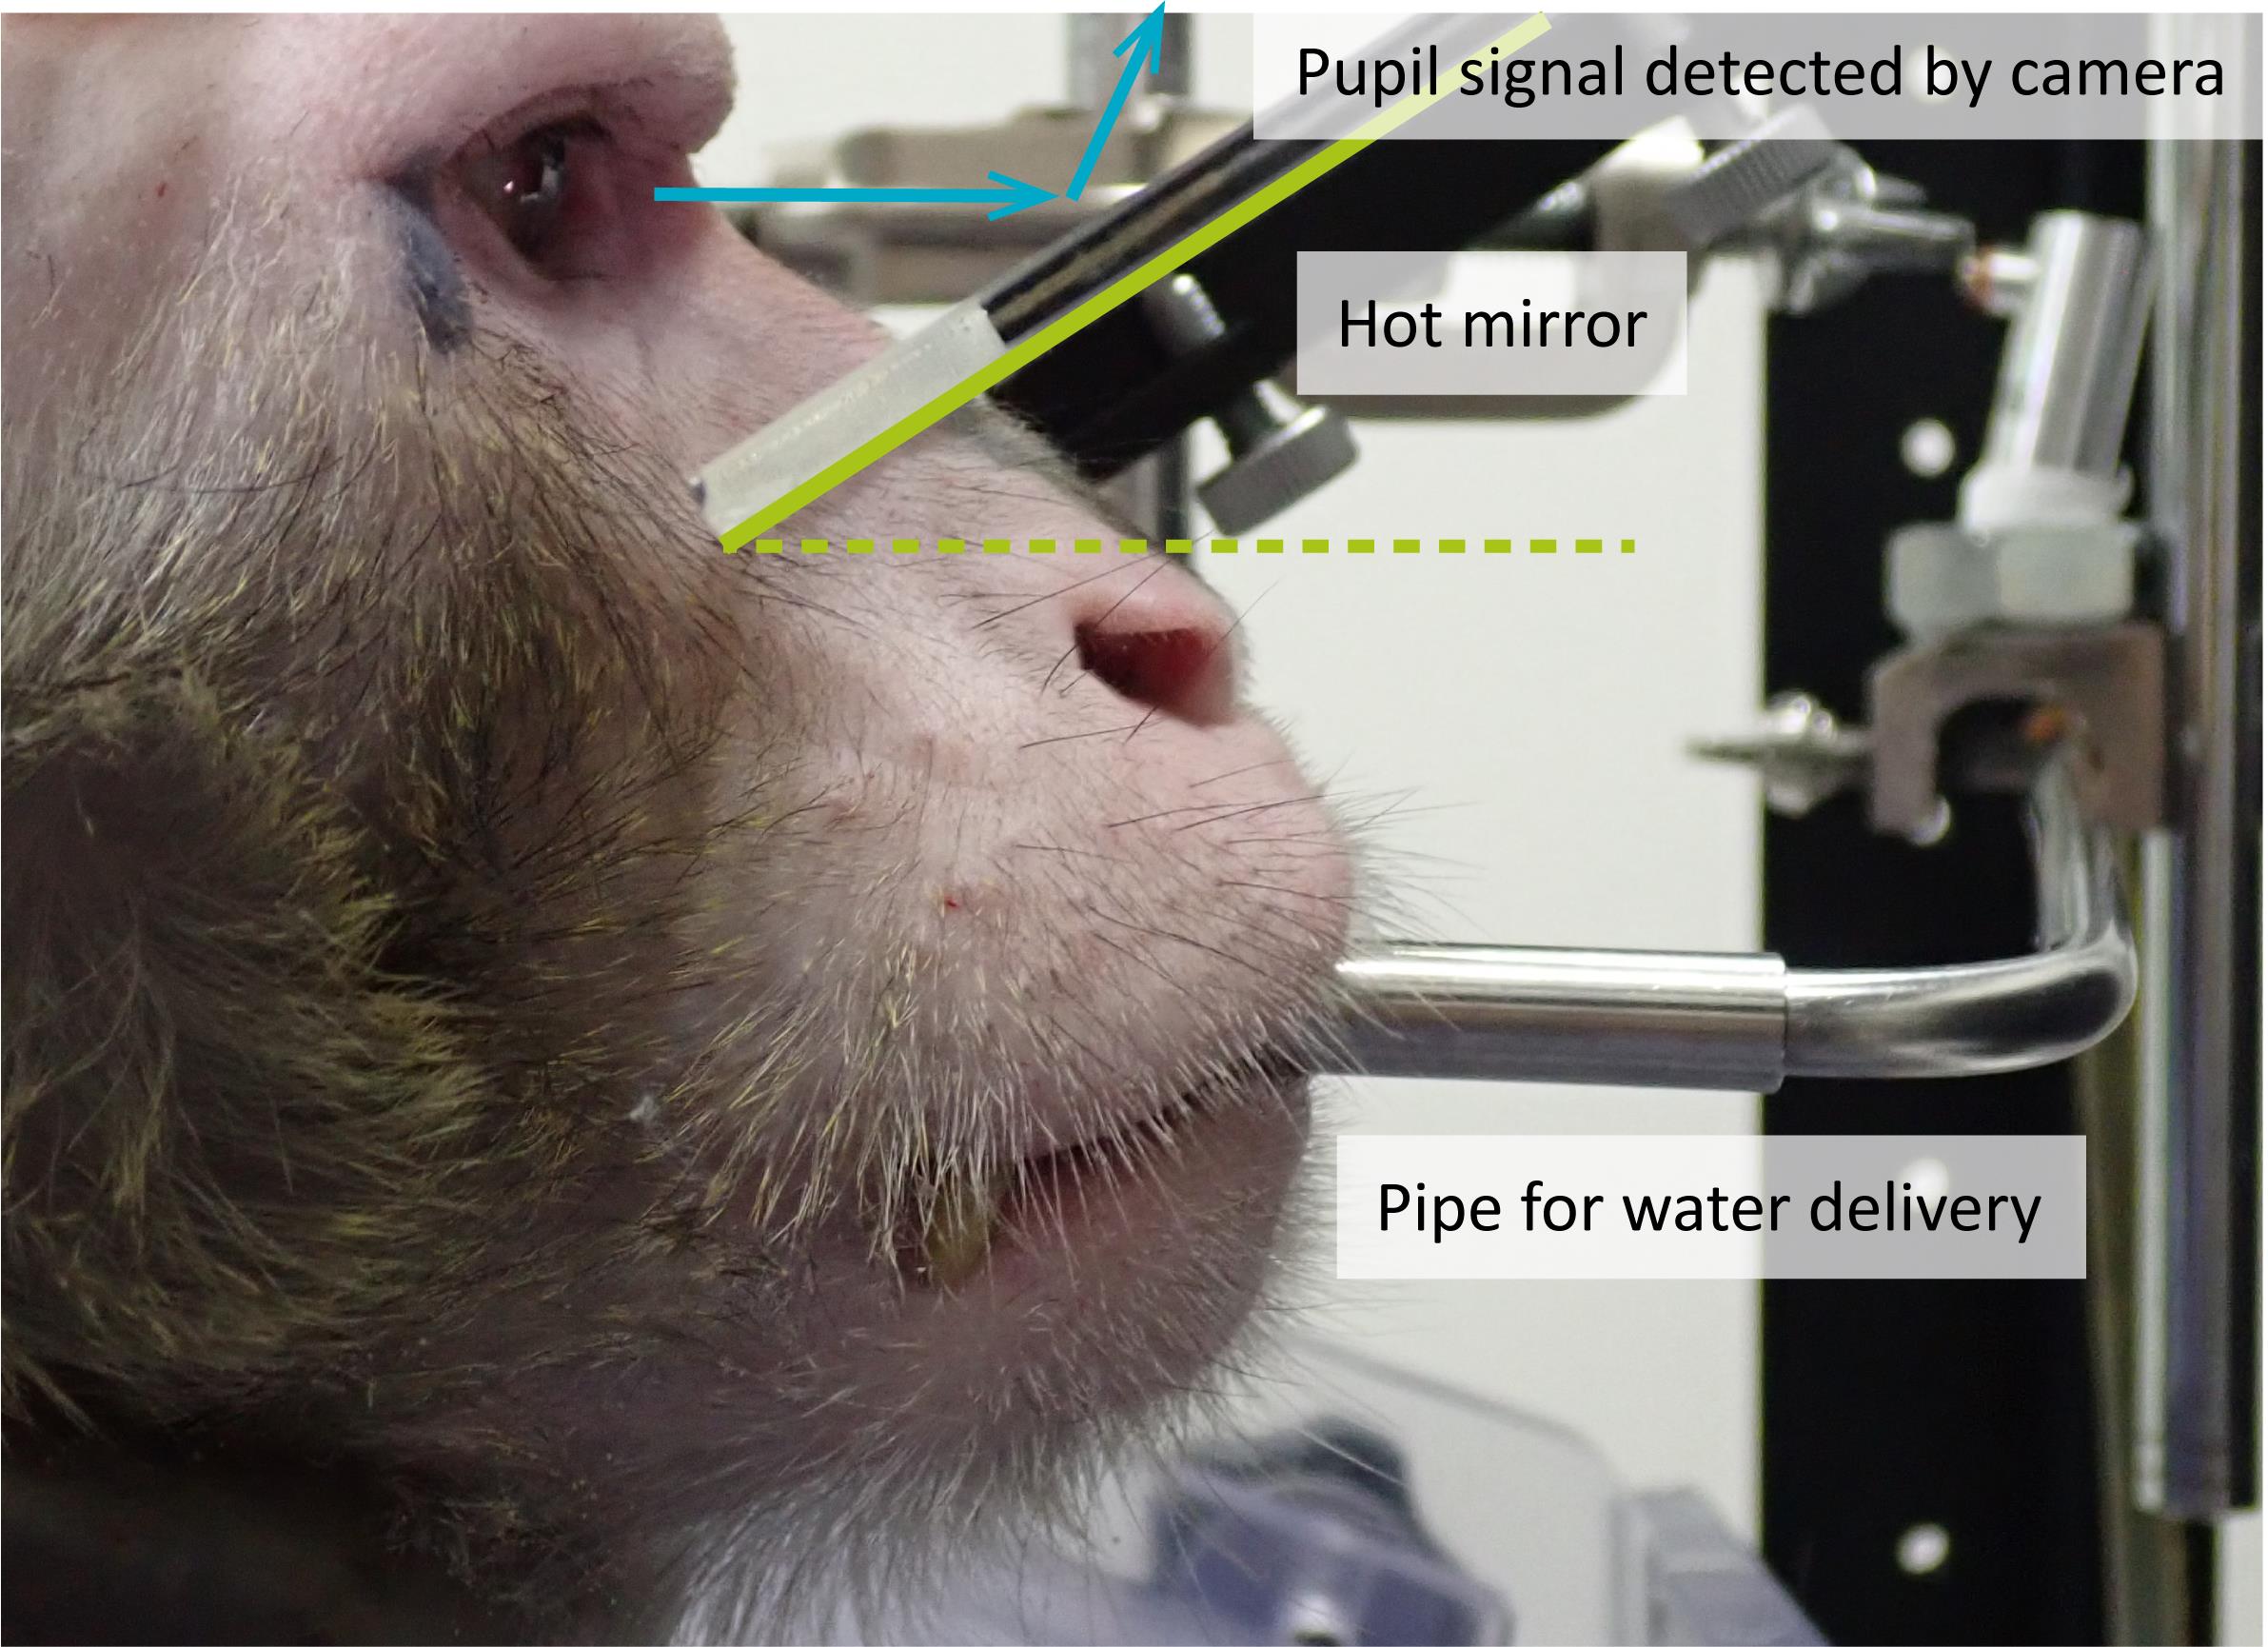
Figure 10. Configurations for eye tracking and water delivery. A hot mirror is placed in front of the monkey’s eyes at an appropriate angle, such that an infrared camera attached above can capture a reflected image of the monkey’s pupils. A liquid reward is delivered into the monkey’s mouth through a pipe.Eye position is detected using an infrared eye tracking system.
A button is set in front of the monkey’s right or left hand (Figure 8).
Events of behavioral tasks (Figure 2B and 2C), such as the presentation of visual object stimuli and the delivery of a liquid reward, are controlled by the TEMPO experimental control system (Figure 1).
The TEMPO experimental control system generates visual stimuli and presents them on the computer monitor toward which the monkey is facing.
The TEMPO experimental control system controls a reward system to deliver a liquid reward into the monkey’s mouth through a stainless-steel pipe (Figures 1 and 10).
Monkey’s behavior, such as eye position and button press/release, are also monitored using the TEMPO experimental control system (Figure 1).
Task training schedule
To allow the monkeys to perform the economic decision-making task (Figure 2A), we first use two visual stimuli that have easily distinguishable visual features and are associated with different amounts of liquid reward. The two visual stimuli are sequentially presented in a random order. The monkey is required to learn the task structure, i.e., to choose the first stimulus by releasing the button during its presentation or the second stimulus by continuing to press the button during the presentation of the first stimulus, in addition to the associations between these two stimuli and the reward amounts. Once the monkey continuously chooses the stimulus associated with the larger reward in at least 90% of trials, we proceed to the next step. This training takes approximately 1 month.
Once the monkey has learned the task structure, we replace the visual stimuli with two of the fractal images shown at the bottom of Figure 2A. After the monkey learns to continuously choose one of the fractal images associated with the larger reward in at least 90% of trials, we add a new fractal image to the visual stimuli set. Once the monkey’s choice rate of the new image becomes larger than the choice rate of the existing images associated with smaller rewards and becomes smaller than the choice rate of those associated with larger rewards, we add another new fractal image. This procedure is repeated until all of the six fractal images have been added. This training takes approximately 3 weeks.
We continue to train the monkey using the six fractal images until the daily choice rate of each image does not largely fluctuate for at least 2 weeks. We do not set a specific criterion for the range in choice rate fluctuation, but it is approximately ±10%. This training takes approximately 2 months.
Single-unit recording
Before single-unit recording experiments, monkeys undergo a magnetic resonance imaging (MRI) scan to determine the location of targeted brain areas (Figure 11).
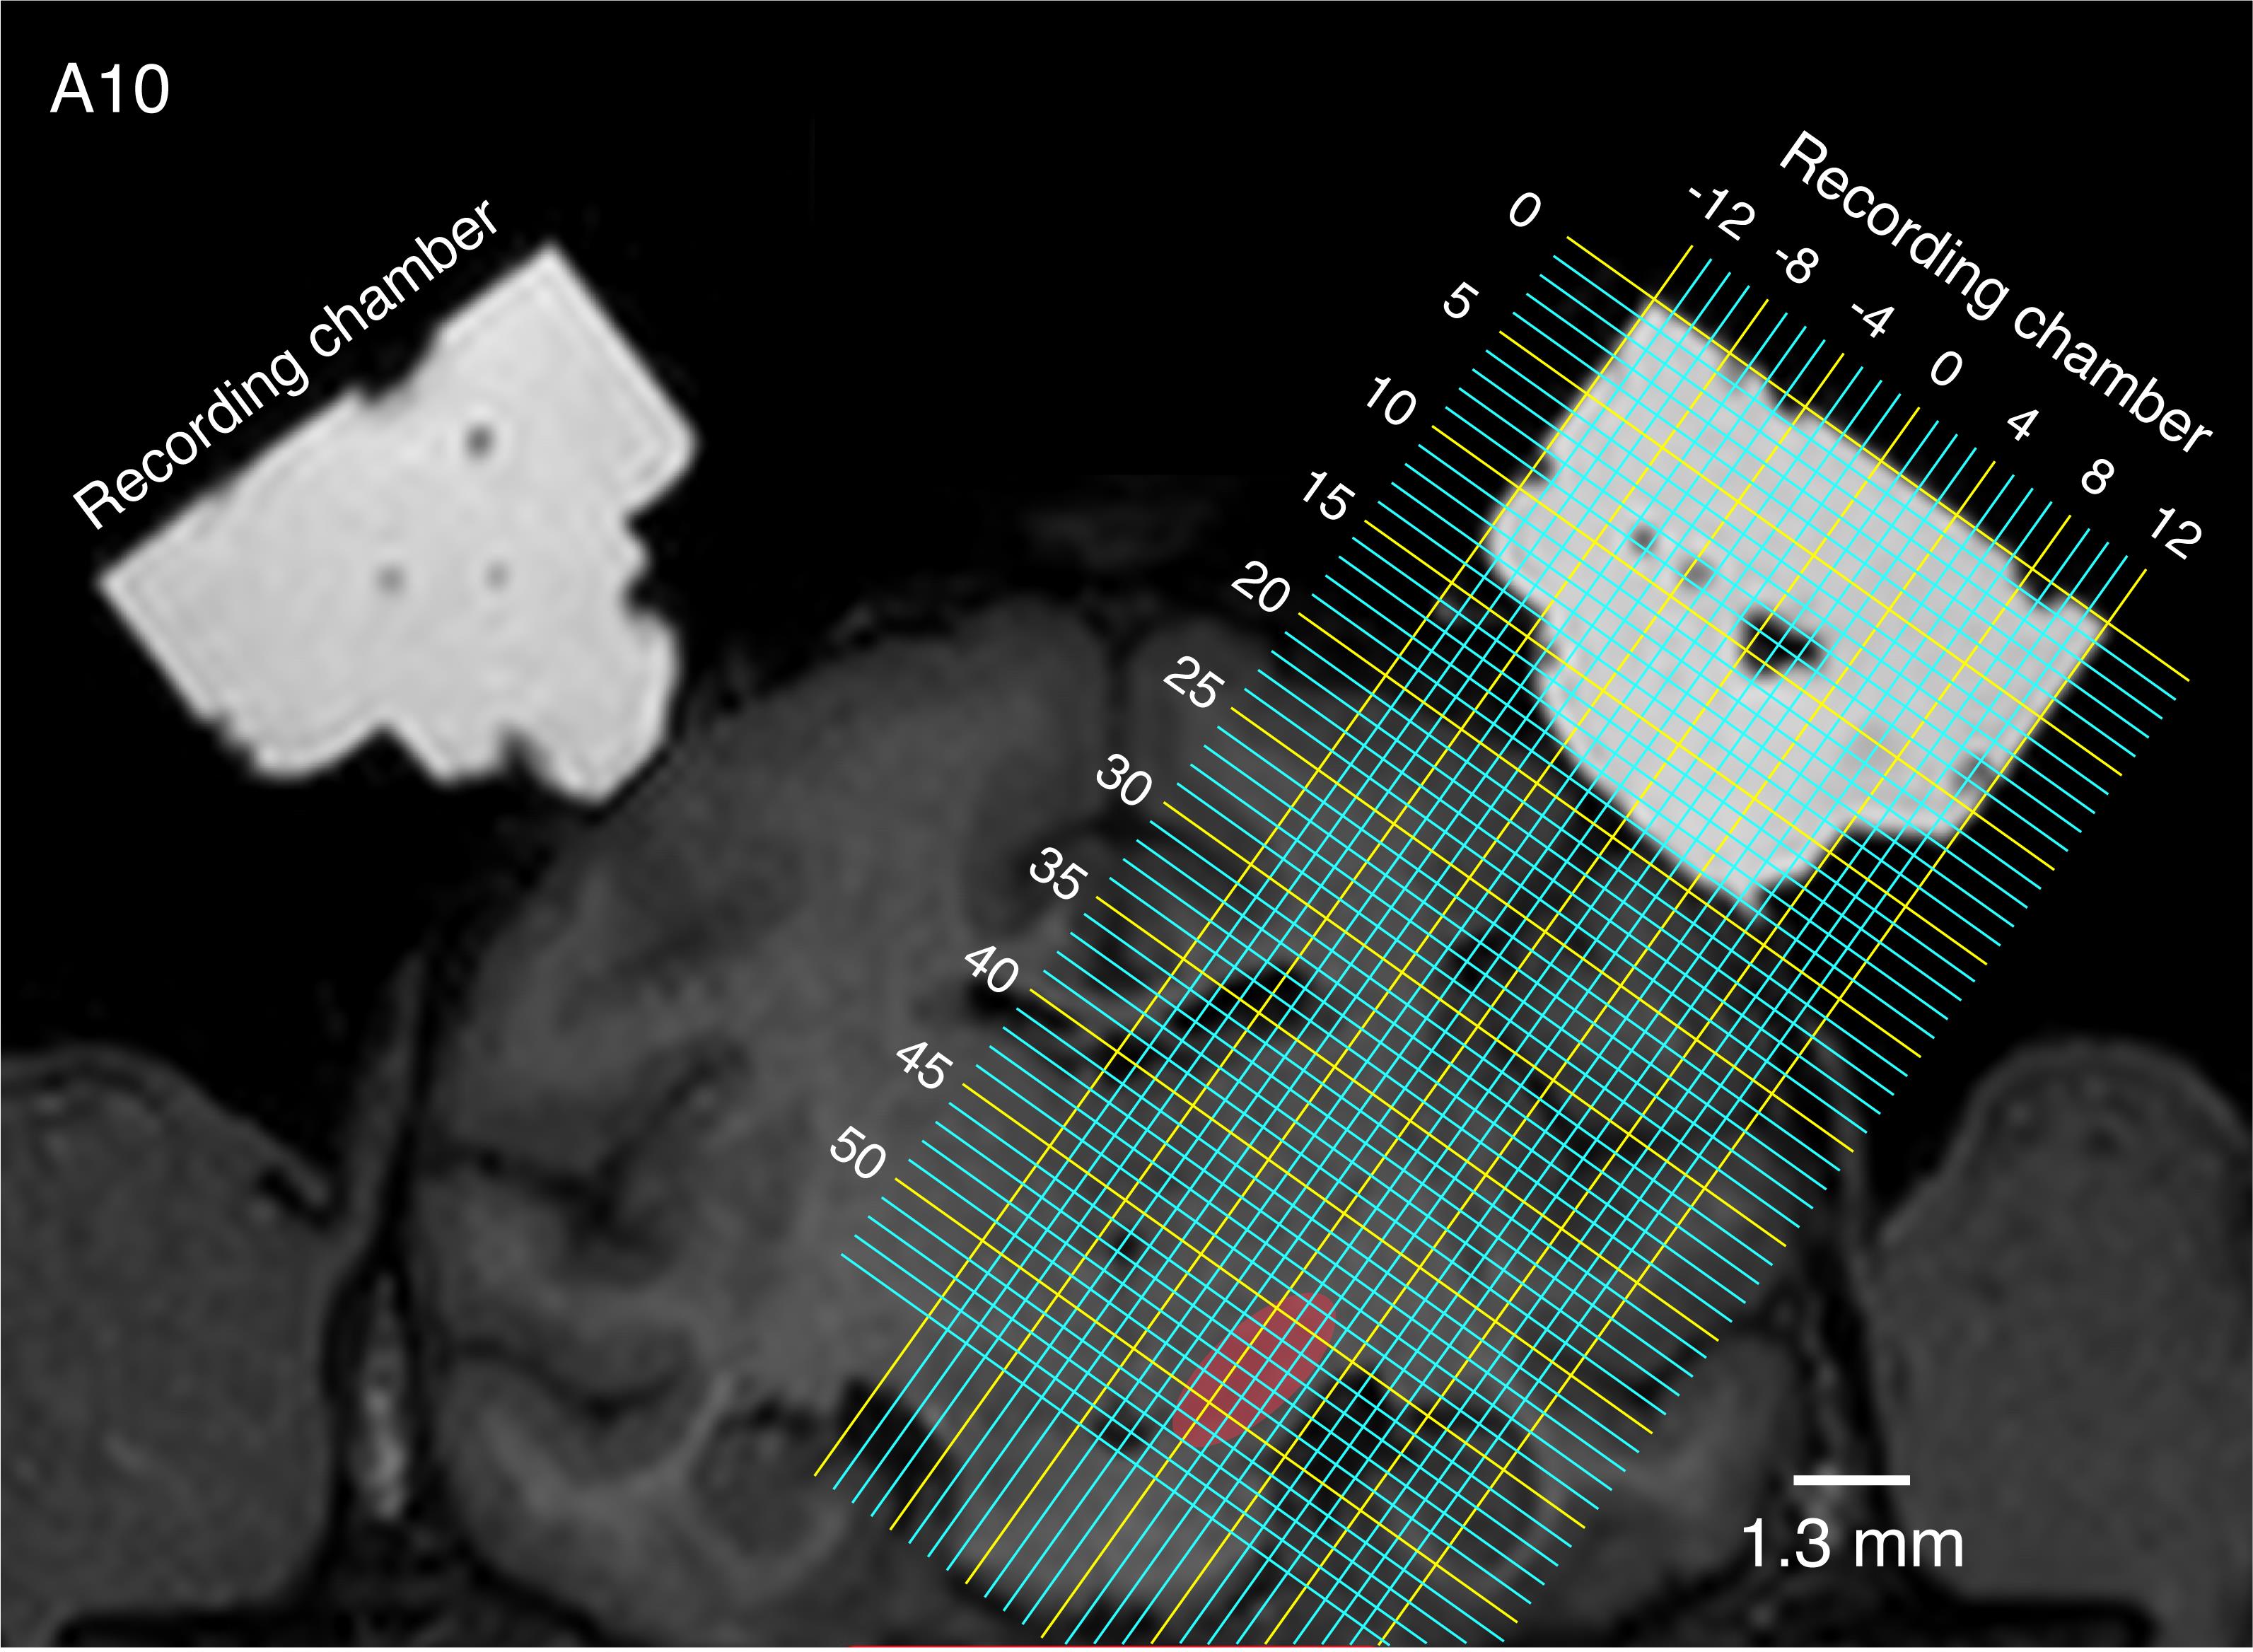
Figure 11. Coronal view of the brain and recording chambers obtained by MRI. The recording chambers are visualized by filling with ointment. Two of the recording chambers target the substantia nigra pars compacta (SNc) and the ventral tegmental area (VTA) in both hemispheres (red shows the location of the right SNc/VTA). The chambers are tilted laterally by 35°, which maximizes the passing distance of a recording electrode in the SNc/VTA, thereby enabling collection of a larger amount of single-unit recording data in these brain regions. Grid lines indicate the distance (millimeters) from (0, 0), the center of the chamber’s surface. A10, anteroposterior distances from the interaural line = 10 mm.Apparatuses for single-unit recording, such as microelectrodes, stainless-steel guide tubes (Figure 7), and recording grids (Figure 4), are sterilized with ethanol and/or chlorhexidine solution and washed with sterilized saline.
The microelectrode is inserted into the guide tube, which come as a set attached to an oil-driven micromanipulator (see Figure 12 for the configurations of the microelectrode, guide tube, and oil-driven micromanipulator). The oil-driven micromanipulator is attached to a hand-driven micromanipulator fixed at one of the bars of the steel frame (Figure 13).
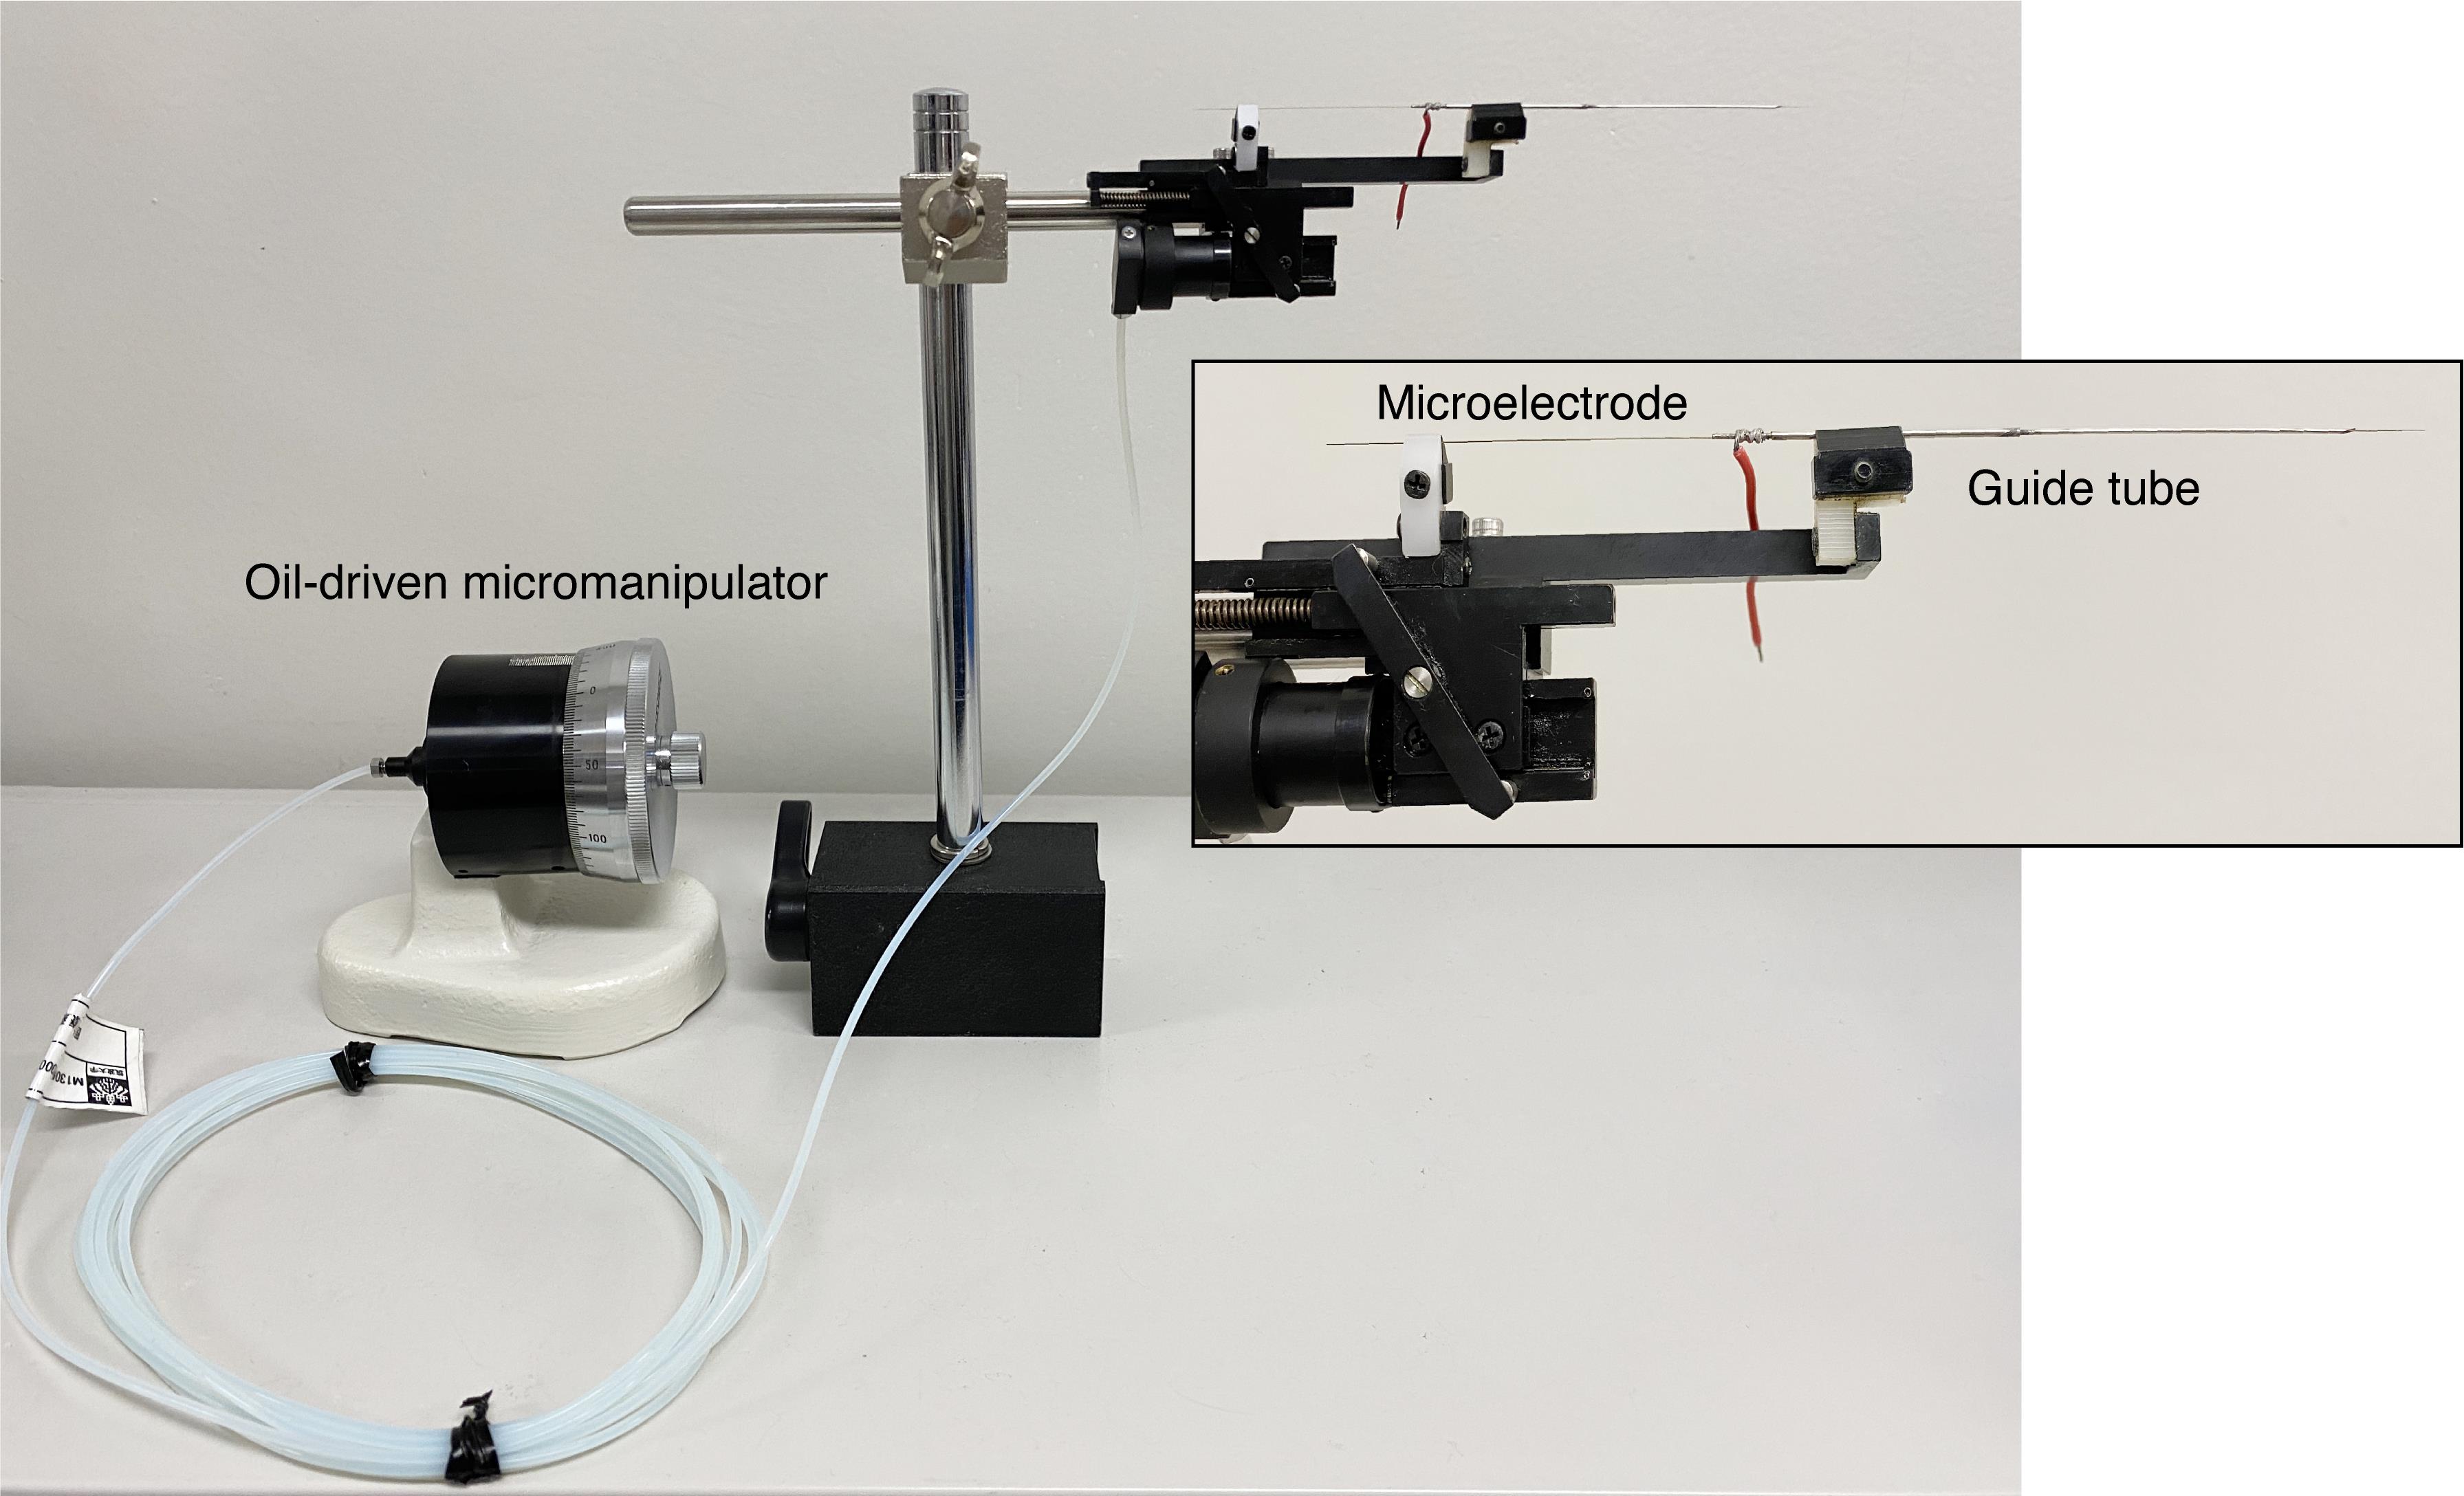
Figure 12. Configurations of the microelectrode, guide tube, and oil-driven micromanipulator. The image insert shows an enlarged view of the set containing the guide tube and microelectrode.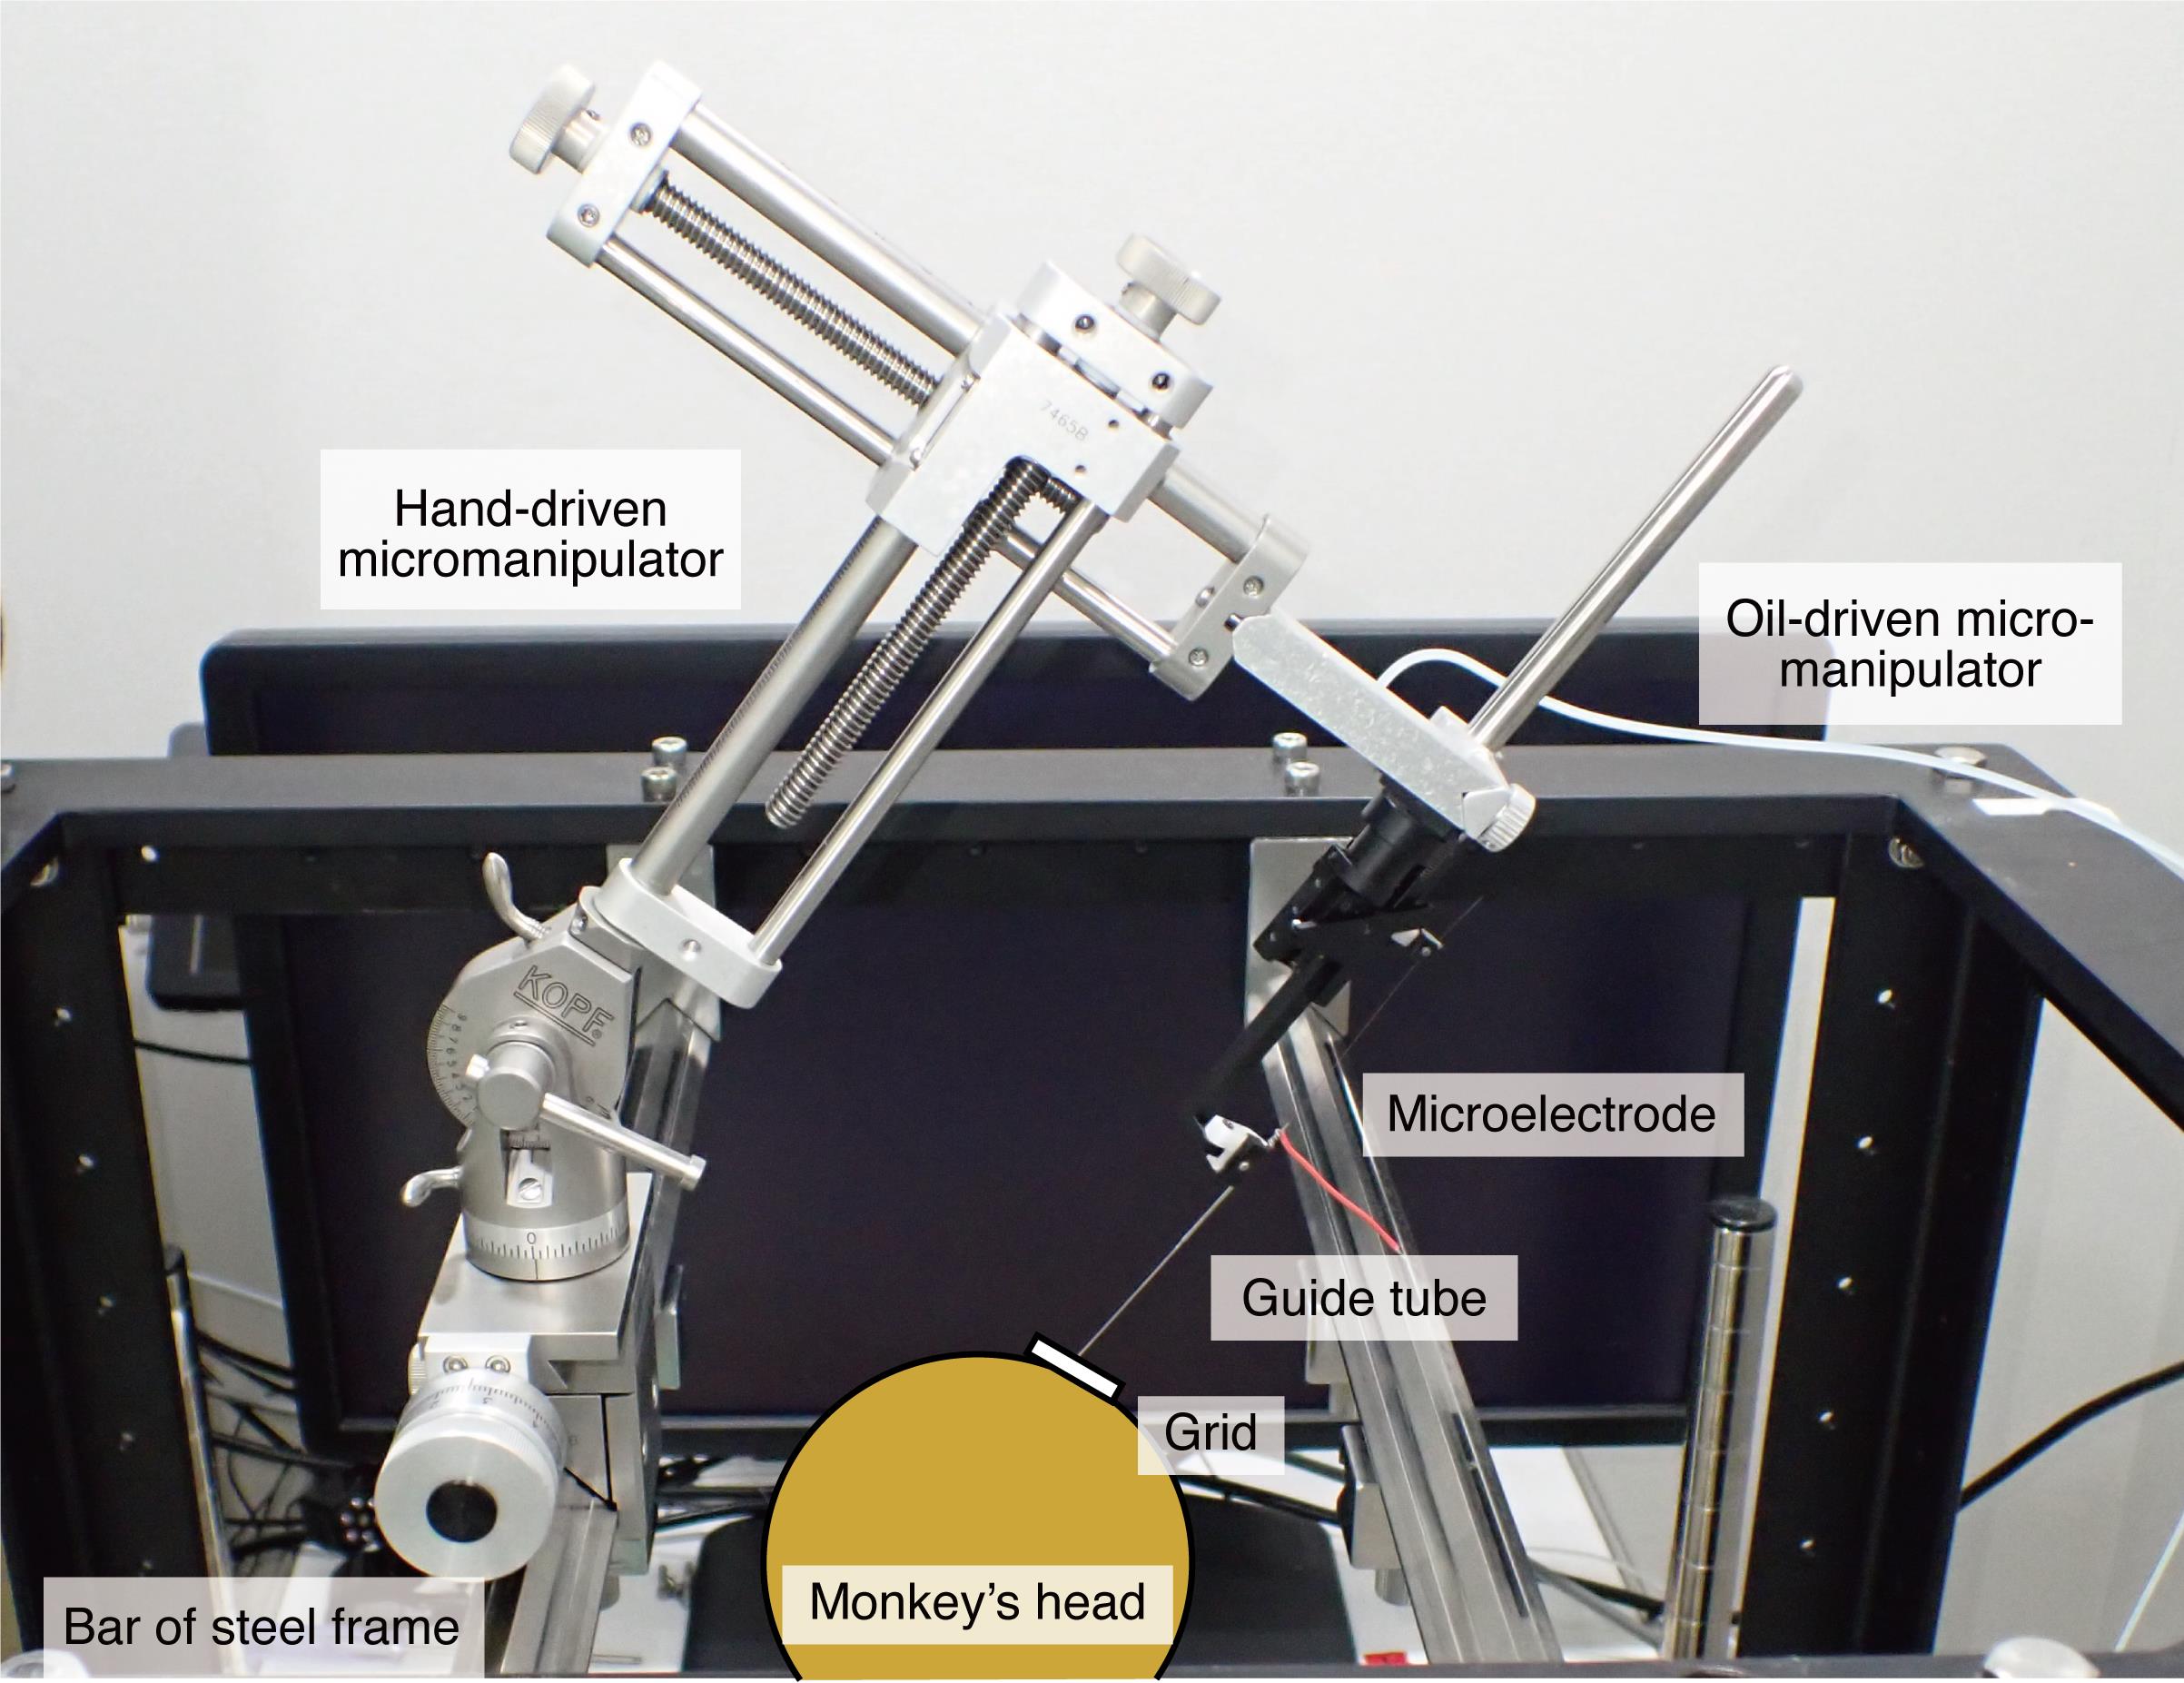
Figure 13. Hand-driven micromanipulator fixed at one of the bars of the steel frameRecording sites are determined using the recording grid, which is attached to the recording chamber and allows recordings at every 1 mm between penetrations (Figures 4 and 11).
The microelectrode is introduced into the brain through the stainless-steel guide tube, which is inserted into one of the grid holes and then into the brain via the dura by the oil-driven micromanipulation (see Figure 13 for the configurations of all apparatuses).
Single-unit potentials are amplified and band-pass filtered (100–8 kHz) using a multi-channel processor (MCP Plus 8), and isolated online using a voltage–time window discrimination system (ASD) (Figure 14). A 50/60 Hz electric noise is removed by a noise eliminator (HumBug). The time of occurrence of each spike recorded from a single-unit is stored at a 1-ms resolution in the TEMPO experimental control system (Figure 1).
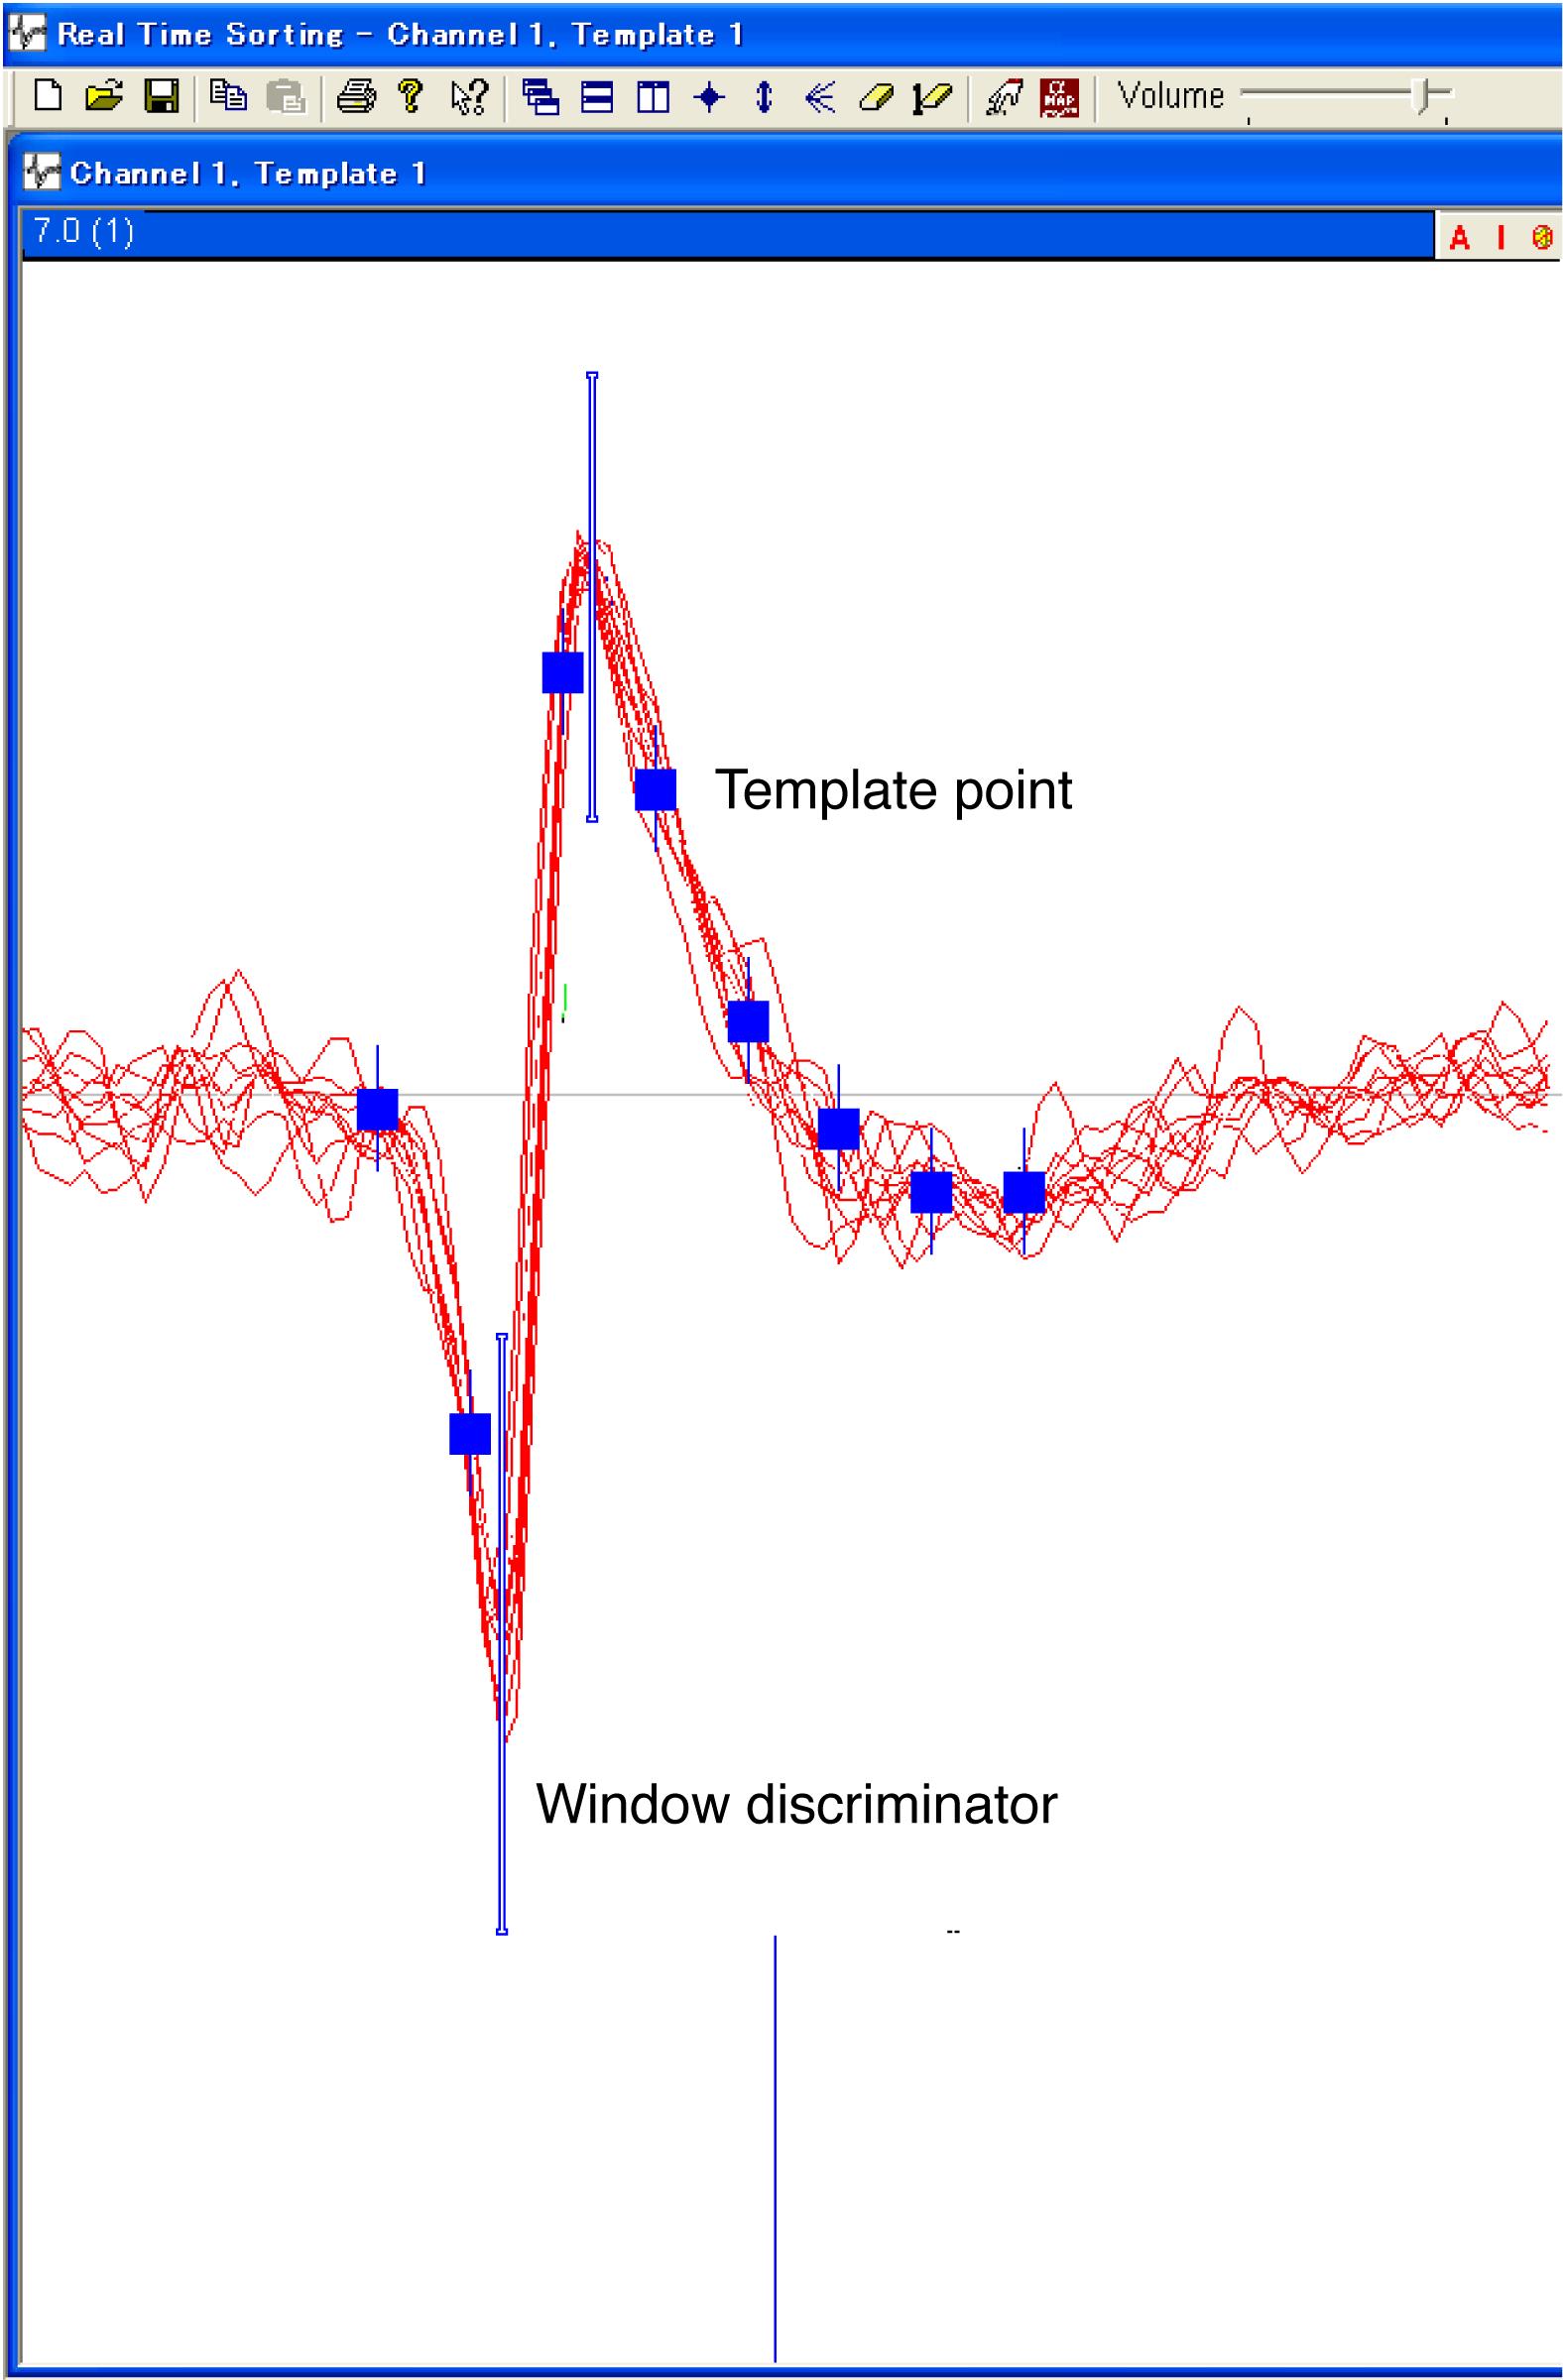
Figure 14. Single-unit spikes isolated by a voltage–time window discrimination system (ASD). ASD isolates single-unit spikes by window-discrimination and template-matching procedures. The two blue vertical lines indicate the windows that discriminate the spikes of a single-unit from those of other single-units and electric noises. The eight blue points define the template of the spike waveform. If the distance between the waveform of each spike and the template is smaller than the detection threshold, the waveform will be regarded as matching the template.
Data analysis
Using the above behavioral and single-unit recording systems, we can record well-isolated single-unit spike data, in addition to well-controlled monkey behavioral data (i.e., button press/release and eye position). Please note that these data are collected along a “unified timeline” by the TEMPO experimental control system. That is, the TEMPO system collects neuronal data across a timeline and uses the same timeline to control the timing of task events (e.g., the onsets of visual stimuli and reward delivery) and memorize the timing of animal behavioral events (e.g., the onset of button-press/release). Thus, neuronal data and task events share the “unified timeline,” which is a critical point to study the relationship between neural activity and behavior. Figure 15A indicates example data in a trial that we recorded from a monkey performing an economic decision-making task (Yun et al., 2020). The red raster plots indicate the time of occurrence of each spike recorded from a single neuron and the blue line indicates the time of occurrence of each task event. The time of occurrence of each spike was aligned at the onset of an event of interest, the aligned spike time data of each trial was superimposed, and then a spike density function (SDF) was calculated by replacing each spike with a Gaussian (σ = 30 ms) (Figure 15B). Both the raster plots and SDF were calculated offline using custom codes by the MATLAB software. Using this procedure, we can analyze how recorded neurons respond to specific task events. More detailed information of the behavioral task and data analyses can be found in the original paper (Yun et al., 2020), e.g., Figures 2 and 6 in the paper).
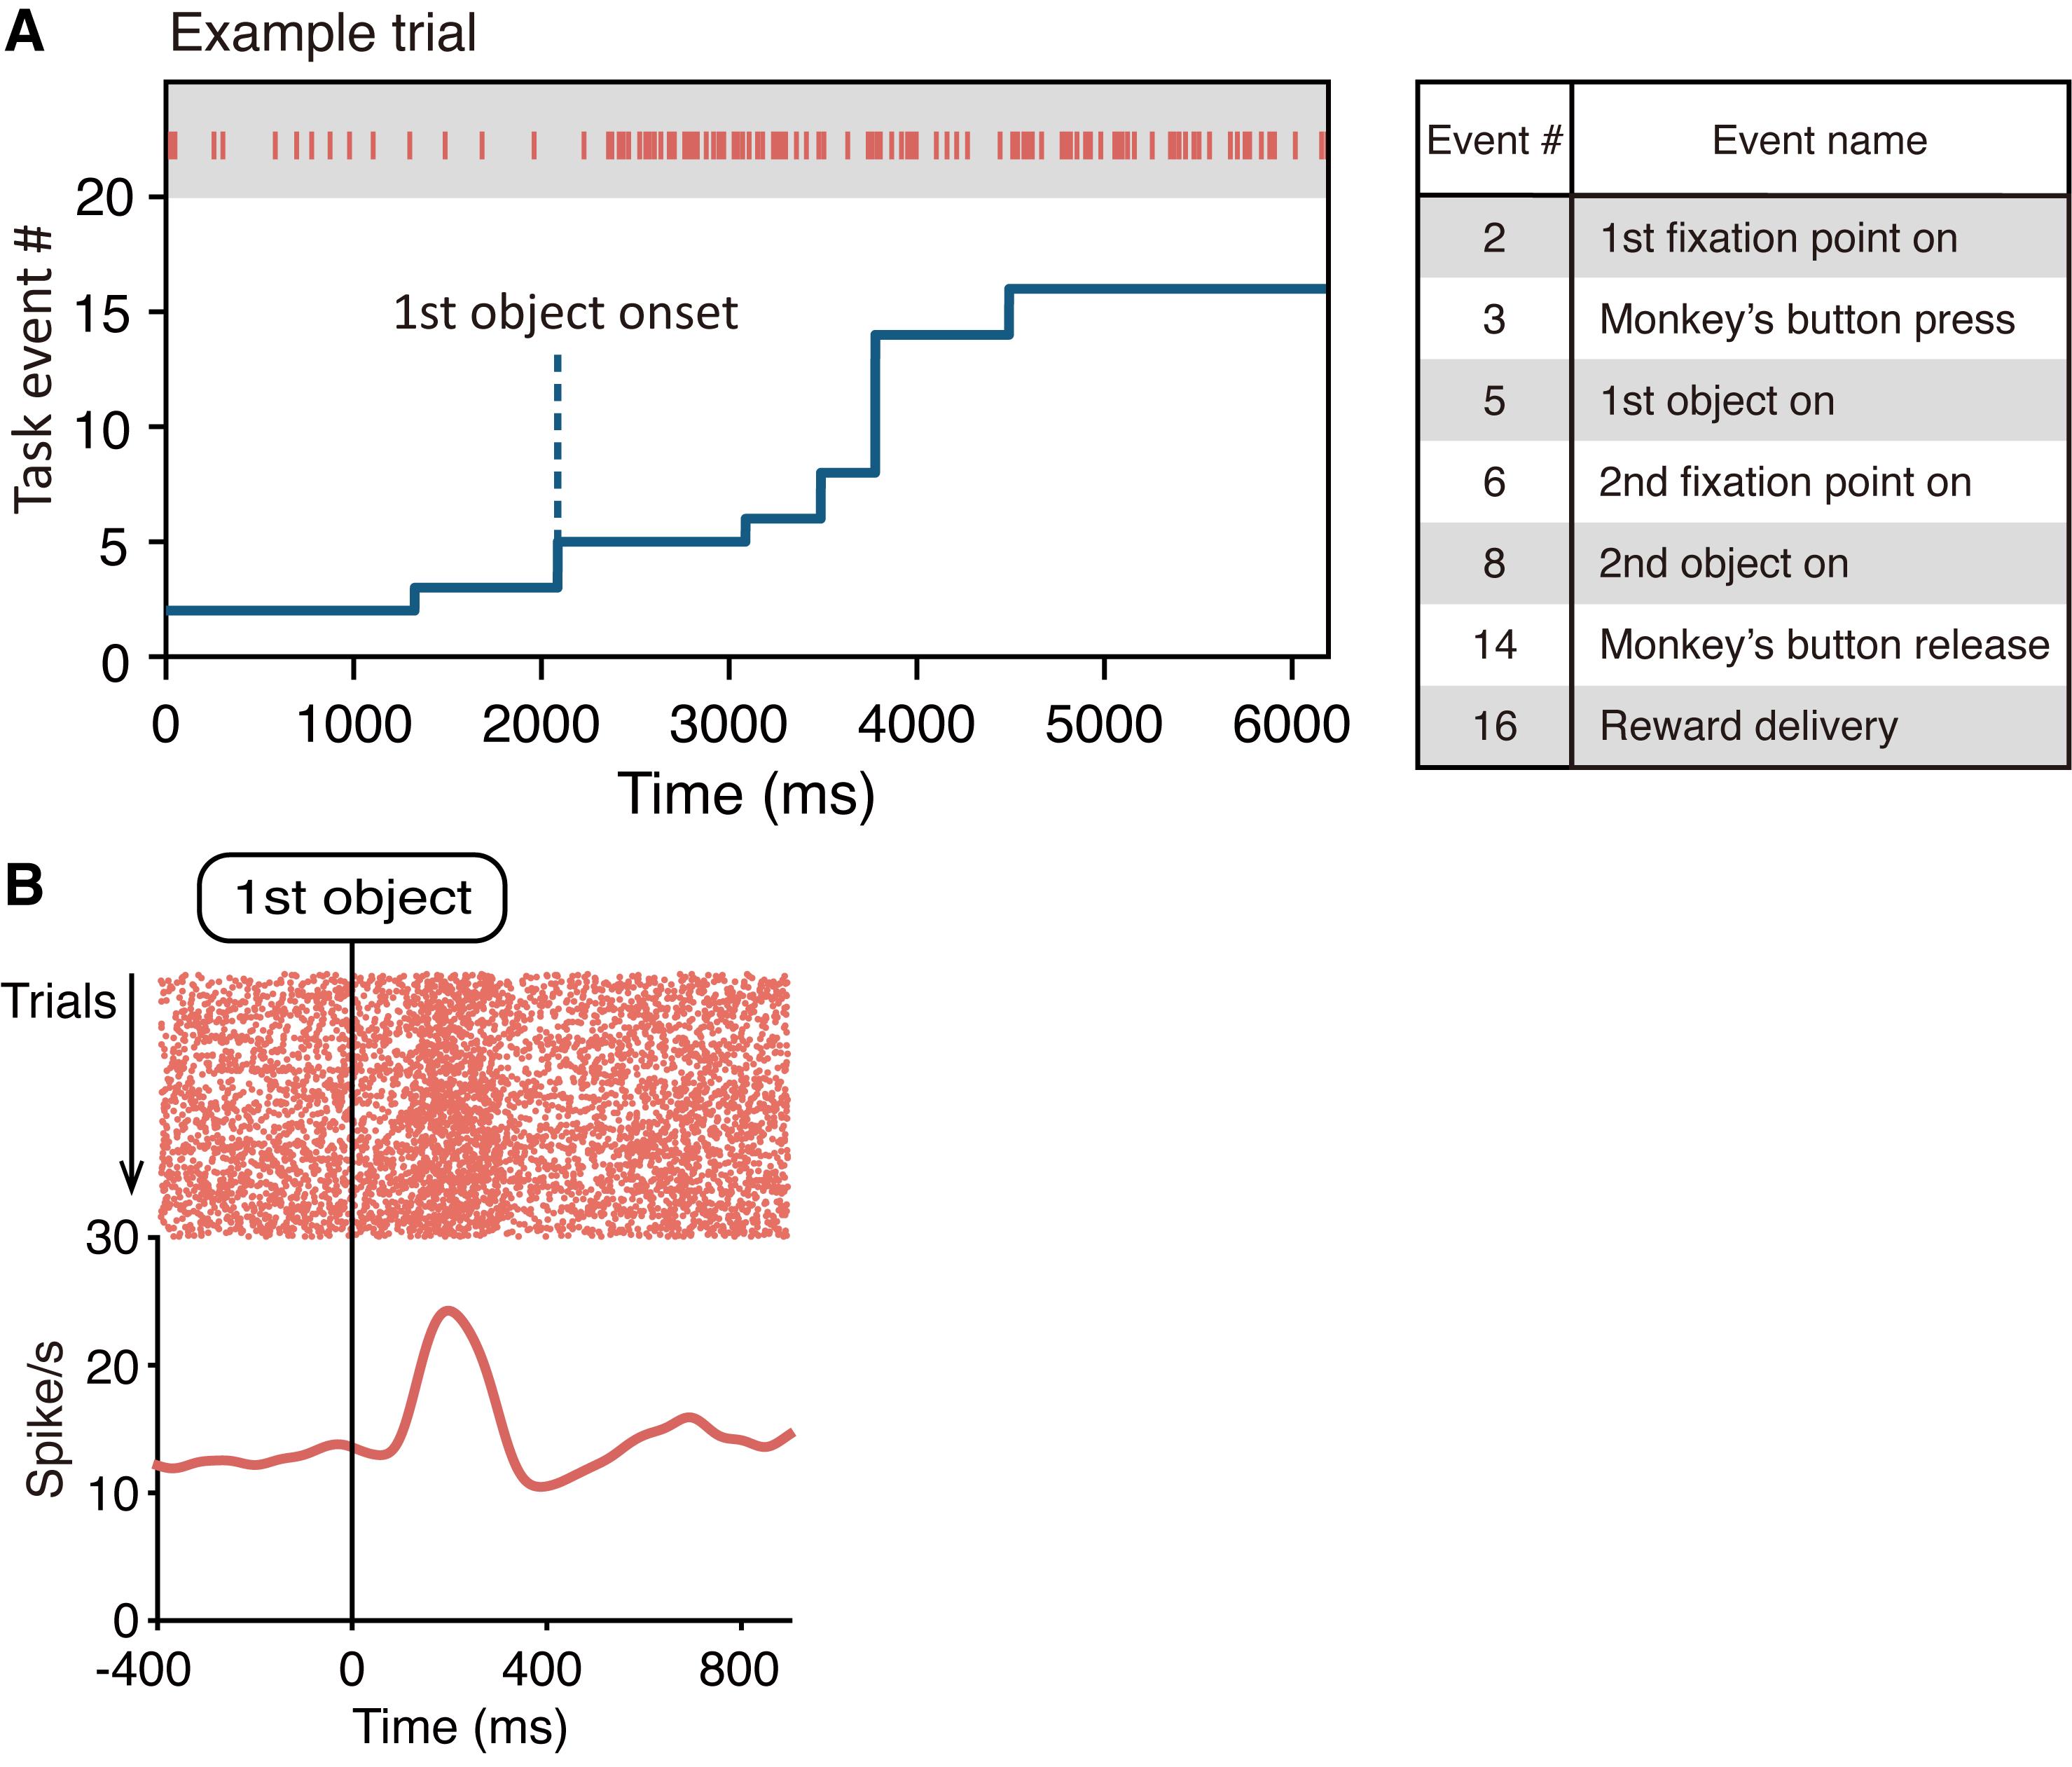
Figure 15. Recorded neuronal data and the time of task events. A. Left, time of occurrence of each spike recorded from a neuron (red raster plots) and time of occurrence of each task event (blue line) collected along a unified timeline. This panel shows the data in a trial that were recorded from a monkey performing an economic decision-making task (Figure 2A). Right, task event numbers (see also Figure 2B and 2C for task events). This task is derived from our original paper (Yun et al., 2020). B. SDF and rasters of a single neuron aligned at the onset of the first object.
Acknowledgments
We thank T. Kawai for helping to set up our experimental system. Funding: this research was supported by MEXT KAKENHI Grant Number JP16H06567 (to M.M.) and JST CREST Grant Number JPMJCR1853 (to M.M). This protocol was derived from our original research paper (Yun et al., 2020).
Competing interests
All authors declare that they have no financial or non-financial competing interests.
Ethics
All procedures for animal care and experimentation were approved by the University of Tsukuba Animal Experiment Committee (permission number: 14-137) and carried out in accordance with the guidelines described in the Guide for the Care and Use of Laboratory Animals published by the Institute for Laboratory Animal Research.
References
- Dubner, R. and Zeki, S. M. (1971). Response properties and receptive fields of cells in an anatomically defined region of the superior temporal sulcus in the monkey. Brain Res 35(2): 528-532.
- Evarts, E. V. (1966). Pyramidal tract activity associated with a conditioned hand movement in the monkey.J Neurophysiol 29(6): 1011-1027.
- Funahashi, S., Bruce, C. J. and Goldman-Rakic, P. S. (1989). Mnemonic coding of visual space in the monkey’s dorsolateral prefrontal cortex. J Neurophysiol61(2): 331-349.
- Gallese, V., Fadiga, L., Fogassi, L. and Rizzolatti, G. (1996). Action recognition in the premotor cortex. Brain 119 ( Pt 2): 593-609.
- Hubel, D. H. and Wiesel, T. N. (1968). Receptive fields and functional architecture of monkey striate cortex. J Physiol 195(1): 215-243.
- Jentsch, J. D., Redmond, D. E., Jr., Elsworth, J. D., Taylor, J. R., Youngren, K. D. and Roth, R. H. (1997). Enduring cognitive deficits and cortical dopamine dysfunction in monkeys after long-term administration of phencyclidine. Science 277(5328): 953-955.
- Kawai, T., Yamada, H., Sato, N., Takada, M. and Matsumoto, M. (2015). Roles of the Lateral Habenula and Anterior Cingulate Cortex in Negative Outcome Monitoring and Behavioral Adjustment in Nonhuman Primates. Neuron 88(4): 792-804.
- Langston, J. W., Forno, L. S., Rebert, C. S. and Irwin, I. (1984). Selective nigral toxicity after systemic administration of 1-methyl-4-phenyl-1,2,5,6-tetrahydropyrine (MPTP) in the squirrel monkey. Brain Res 292(2): 390-394.
- Luck, S. J., Chelazzi, L., Hillyard, S. A. and Desimone, R. (1997). Neural mechanisms of spatial selective attention in areas V1, V2, and V4 of macaque visual cortex.J Neurophysiol 77(1): 24-42.
- Matsumoto, M. and Takada, M. (2013). Distinct representations of cognitive and motivational signals in midbrain dopamine neurons. Neuron 79(5): 1011-1024.
- Middlebrooks, P. G. and Sommer, M. A. (2012). Neuronal correlates of metacognition in primate frontal cortex. Neuron 75(3): 517-530.
- Miller, E. K., Erickson, C. A. and Desimone, R. (1996). Neural mechanisms of visual working memory in prefrontal cortex of the macaque. J Neurosci 16(16): 5154-5167.
- Miyamoto, K., Osada, T., Setsuie, R., Takeda, M., Tamura, K., Adachi, Y. and Miyashita, Y. (2017). Causal neural network of metamemory for retrospection in primates. Science 355(6321): 188-193.
- Noritake, A., Ninomiya, T. and Isoda, M. (2018). Social reward monitoring and valuation in the macaque brain. Nat Neurosci 21(10): 1452-1462.
- Ogasawara, T., Nejime, M., Takada, M. and Matsumoto, M. (2018). Primate Nigrostriatal Dopamine System Regulates Saccadic Response Inhibition. Neuron 100(6): 1513-1526 e1514.
- Padoa-Schioppa, C. and Assad, J. A. (2006). Neurons in the orbitofrontal cortex encode economic value. Nature 441(7090): 223-226.
- Perrett, D. I., Rolls, E. T. and Caan, W. (1982). Visual neurones responsive to faces in the monkey temporal cortex. Exp Brain Res 47(3): 329-342.
- Shadlen, M. N. and Newsome, W. T. (2001). Neural basis of a perceptual decision in the parietal cortex (area LIP) of the rhesus monkey. J Neurophysiol 86(4): 1916-1936.
- Treue, S. and Maunsell, J. H. (1996). Attentional modulation of visual motion processing in cortical areas MT and MST. Nature 382(6591): 539-541.
- Wurtz, R. H. (1968). Visual cortex neurons: response to stimuli during rapid eye movements. Science 162(3858): 1148-1150.
- Yun, M., Kawai, T., Nejime, M., Yamada, H. and Matsumoto, M. (2020). Signal dynamics of midbrain dopamine neurons during economic decision-making in monkeys. Sci Adv 6(27): eaba4962.
Article Information
Publication history
Accepted: Feb 12, 2021
Published: Apr 20, 2021
Copyright
© 2021 The Authors; exclusive licensee Bio-protocol LLC.
How to cite
Readers should cite both the Bio-protocol article and the original research article where this protocol was used:
- Yun, M., Nejime, M. and Matsumoto, M. (2021). Single-unit Recording in Awake Behaving Non-human Primates. Bio-protocol 11(8): e3987. DOI: 10.21769/BioProtoc.3987.
- Yun, M., Kawai, T., Nejime, M., Yamada, H. and Matsumoto, M. (2020). Signal dynamics of midbrain dopamine neurons during economic decision-making in monkeys. Sci Adv 6(27): eaba4962.
Category
Neuroscience > Basic technology
Do you have any questions about this protocol?
Post your question to gather feedback from the community. We will also invite the authors of this article to respond.
![]() Tips for asking effective questions
Tips for asking effective questions
+ Description
Write a detailed description. Include all information that will help others answer your question including experimental processes, conditions, and relevant images.