
- Submit a Protocol
- Receive Our Alerts
- EN

- Protocols

- Articles and Issues
- For Authors
- About
- Become a Reviewer

Intravenous and Non-invasive Drug Delivery to the Mouse Basal Forebrain Using MRI-guided Focused Ultrasound
Published: Vol 11, Iss 12, Jun 20, 2021 DOI: 10.21769/BioProtoc.4056 Views: 3311
Reviewed by: Miao HeRuiqi WuNafisa M. JadavjiAnonymous reviewer(s)
Original research article
The authors used this protocol in:

Jan 2020

Protocol Collections
Comprehensive collections of detailed, peer-reviewed protocols focusing on specific topics

Related protocols
Abstract
Basal forebrain cholinergic neurons (BFCNs) regulate circuit dynamics underlying cognitive processing, including attention, memory, and cognitive flexibility. In Alzheimer’s disease and related neurodegenerative conditions, the degeneration of BFCNs has long been considered a key player in cognitive decline. The cholinergic system thus represents a key therapeutic target. A long-standing obstacle for the development of effective cholinergic-based therapies is not only the production of biologically active compounds but also a platform for safe and efficient drug delivery to the basal forebrain. The blood-brain barrier (BBB) presents a significant challenge for drug delivery to the brain, excluding approximately 98% of small-molecule biologics and nearly 100% of large-molecule therapeutic agents from entry into the brain parenchyma. Current modalities to achieve effective drug delivery to deep brain structures, such as the basal forebrain, are particularly limited. Direct intracranial injection via a needle or catheter carries risks associated with invasive neurosurgery. Intra-arterial injection of hyperosmotic solutions or therapeutics modified to penetrate the BBB using endogenous transport systems lack regional specificity, which may not always be desirable. Intranasal, intrathecal, and intraventricular administration have limited drug distribution beyond the brain surface. Here, we present a protocol for non-invasively, locally, and transiently increasing BBB permeability using MRI-guided focused ultrasound (MRIgFUS) in the murine basal forebrain for delivery of therapeutic agents targeting the cholinergic system. Ongoing work in preclinical models and clinical trials supports the safety and feasibility of MRIgFUS-mediated BBB modulation as a promising drug delivery modality for the treatment of debilitating neurological diseases.
Keywords: Basal forebrainBackground
The majority of cholinergic afferents in cortical and limbic structures involved in cognition originate from long-range projection neurons located in the basal forebrain (Hampel et al., 2018). Basal forebrain cholinergic neurons (BFCNs) are highly vulnerable in Alzheimer’s disease (AD) and other neurodegenerative diseases, including vascular dementia, Lewy body dementia, frontotemporal dementia, amyotrophic lateral sclerosis, and Parkinson’s disease, and contribute significantly to cognitive decline (Cykowski et al., 2014; Grothe et al., 2014; Hampel et al., 2018; Ray et al., 2018; Convery et al., 2020), validating BFCNs as an important therapeutic target. Although current clinically approved cholinergic agents for the treatment of AD have shown only modest benefits on cognition, recent studies suggest that they may also modify the course of disease with continued use (Dubois et al., 2015; Cavedo et al., 2016 and 2017). It is possible that the modest impact on cognition may reflect the drug dose that can be achieved; higher doses, which could be of greater benefit, cannot be tolerated due to peripheral side effects (Birks and Harvey, 2018). Other putative cholinergic agents, such as trophic factors and related gene therapies, which have the potential to simulate cholinergic function and prevent cholinergic degeneration, do not cross the blood-brain barrier (BBB) (Chen and Mobley, 2019; Xhima and Aubert, 2021). Thus, a major obstacle for the development of cholinergic-targeted agents, and brain-targeted therapeutics in general, is not only the production of biologically active compounds but a way to deliver them safely and efficiently to the brain.
Approximately 98% of small molecules and nearly 100% of large molecule drugs, including recombinant proteins, antibodies, and gene-related therapeutics, are unable to cross the BBB when administered systemically (Pardridge et al., 2020). Current approaches that accomplish direct drug delivery involve highly invasive intracranial procedures with multiple injections to reach the basal forebrain; these procedures carry substantial risk for surgical complications, and control of drug distribution can be difficult because drug concentration decreases exponentially from the injection site (Honig et al., 2018; Castle et al., 2020; Pardridge et al., 2020). Other approaches include: (1) intra-arterial injection of hyperosmotic solutions, such as mannitol, to increase BBB permeability, coupled with peripheral drug delivery; (2) systemic administration of therapeutics linked to protein vector delivery systems that can cross the BBB; (3) intraocular delivery; and (4) intranasal administration. However, even if therapeutics reach the brain in adequate concentrations with these methods, drug biodistribution will be non-targeted and may cause indiscriminate actions on all cholinergic synapses in the brain rather than BFCNs.
Transcranial focused ultrasound (FUS) in combination with intravenously injected microbubbles (i.e., an air/perfluorocarbon gas core stabilized by a phospholipid/protein/polymer shell) can transiently enhance BBB permeability in the targeted volume (Hynynen et al., 2001). FUS offers a minimally invasive avenue to deliver a variety of therapeutic agents to the brain with the advantages of being able to temporarily permeabilize the BBB in specific brain regions without widespread drug exposure elsewhere in the brain and to potentially reduce the peripheral dose required to achieve the desired bioeffects in the brain (Meng et al., 2020). Additionally, FUS targeting systems can be co-registered to the spatial coordinates of MRI scanners, allowing for highly precise BBB modulation in specific neuroanatomical locations, such as the basal forebrain (Xhima et al., 2020). Gadolinium-based MRI contrast agents, excluded by the intact BBB, offer the added advantage of confirming the site of therapeutic delivery following FUS exposure. In a recent study, we established the feasibility of MRI-guided FUS (MRIgFUS)-induced BBB modulation in the basal forebrain for drug delivery in an AD mouse model (Xhima et al., 2020). Here, we present a detailed protocol for using MRIgFUS to non-invasively and locally deliver intravenously administered therapeutic agents to the murine basal forebrain for preclinical drug development.
Materials and Reagents
Cotton tipped applicators (AMG Medical Inc., catalog number: 018-450)
Non-woven sponges (Covidien, catalog number: 9022)
Medical tape (3M, catalog number: 1527-1)
70% isopropyl alcohol pads (Alliance, catalog number: 211-MM-05507)
Circulating water warming pad (Stryker, catalog number: TP700)
26 G angiocatheter (Venisystems Abbocath-T, catalog number: G944-A01)
Catheter injection cap (SAI Infusion Technologies, catalog number: IC)
1 ml insulin syringes (BD Biosciences, catalog number: BD329654)
27 G needles (BD Biosciences, catalog number: BD305109)
18 G blunt-fill needles (BD Biosciences, catalog number: BD305180)
Wavelength clear ultrasound gel (National Therapy Products Inc., catalog number: NTPC502X)
Saline bags heated by immersion in a water bath at 37°C
Adult mice, 20-50 g
Therapeutic agent of interest
Sterile normal saline (Baxter, catalog number: 2B1307)
Sterile heparinized saline (Baxter, catalog number: AHB0953U)
Depilatory cream (e.g., Veet or Nair)
Lubricant eye ointment (Refresh Lacri-Lube, Allergan, catalog number: 00210889)
Definity microbubbles (Lantheus Medical Imaging, catalog number: DE4). Storage: 4°C
Gadovist (Bayer, catalog number: 02241089). Storage: room temperature
Isoflurane (Fresenius Kabi, catalog number: M60303)
Equipment
Scissors (Fine Science Tools, catalog number: 14088-10)
Small animal electric hair trimmer (Wahl Clipper, catalog number: 58112)
Forced-air warming unit with blanket (Medtronic, catalog number: WT 6000)
Small animal weigh scale
Vialmix mechanical shaking device (Lantheus Medical Imaging, catalog number: VMIX)
Small animal anesthesia machine connected to an induction chamber and nose cone
Plastic tubing to connect the anesthesia machine to the animal positioned on the FUS system and MR scanner
Class IIA2 biosafety cabinet for tail vein catheterization
Small animal 7T MRI (Bruker, 7T horizontal bore Avance BioSpec 70/30 USR scanner)
MRI body coil (Bruker, model: 86 mm Quad SN37)
MRI surface coil (Bruker, model: 86 mm Quad Receive)
LP100 focused ultrasound system (FUS Instruments, Inc.) including:
1.68 MHz spherically curved transducer (0.8 focal number, 75 mm external diameter, 20 mm internal diameter)
Polyvinylidene difluoride or lead zirconate titanate hydrophone
Function generator
14-bit scope card
50 W RF power amplifier
RF power meter
External matching circuit
Motorized positioning system in all three orthogonal axes
Degassed and deionized water tank
MRI-compatible sled equipped with an anesthesia nose cone and a fixture that consists of two Kapton polyimide membranes containing degassed and deionized water
MR-compatible focus finding marker
Oxygen supply
Medical air supply
Software
ParaVision 5.0 (Bruker)
Software for controlling and monitoring FUS exposure (FUS Instruments, Inc.)
Procedure
Obtain approval for the animal use protocol from the affiliated institution
The animal experiments must follow guidelines and policies set forth by the facility Animal Care Committee in accordance with relevant government legislation.
Experimental setup and co-registration of MRI and the FUS system
The experimental setup of the FUS system is illustrated in Figure 1A to 1D.
Mount the ultrasound transducer to the arm of the motorized positioning system and immerse it into the degassed and deionized water tank.
Establish connections between the components of the FUS system (see Figure 1A).
Place the MR-compatible sled to be spatially registered on the plate over the water bath.
Position the transducer underneath the polyimide membrane fixture. Sonicate using continuous mode at 0.5 W and position the transducer focus at the water surface tank to produce a small cone-shaped fountain of water.
Tape the focus finding marker at the transducer focus. Turn off the output of the function generator.
Place the sled into the MRI scanner and perform a three-axis localizer scan of the focus finding marker. Using the FUS Instruments software, input the MRI spatial coordinates of the marker to co-register the transducer positioning system with the imaging system. In Xhima et al. (2020), a FLASH tripilot sequence with TE/TR = 3 ms/200 ms, slice thickness = 1 mm, and in-plane resolution = 0.23 × 0.23 mm was performed to acquire MR images.
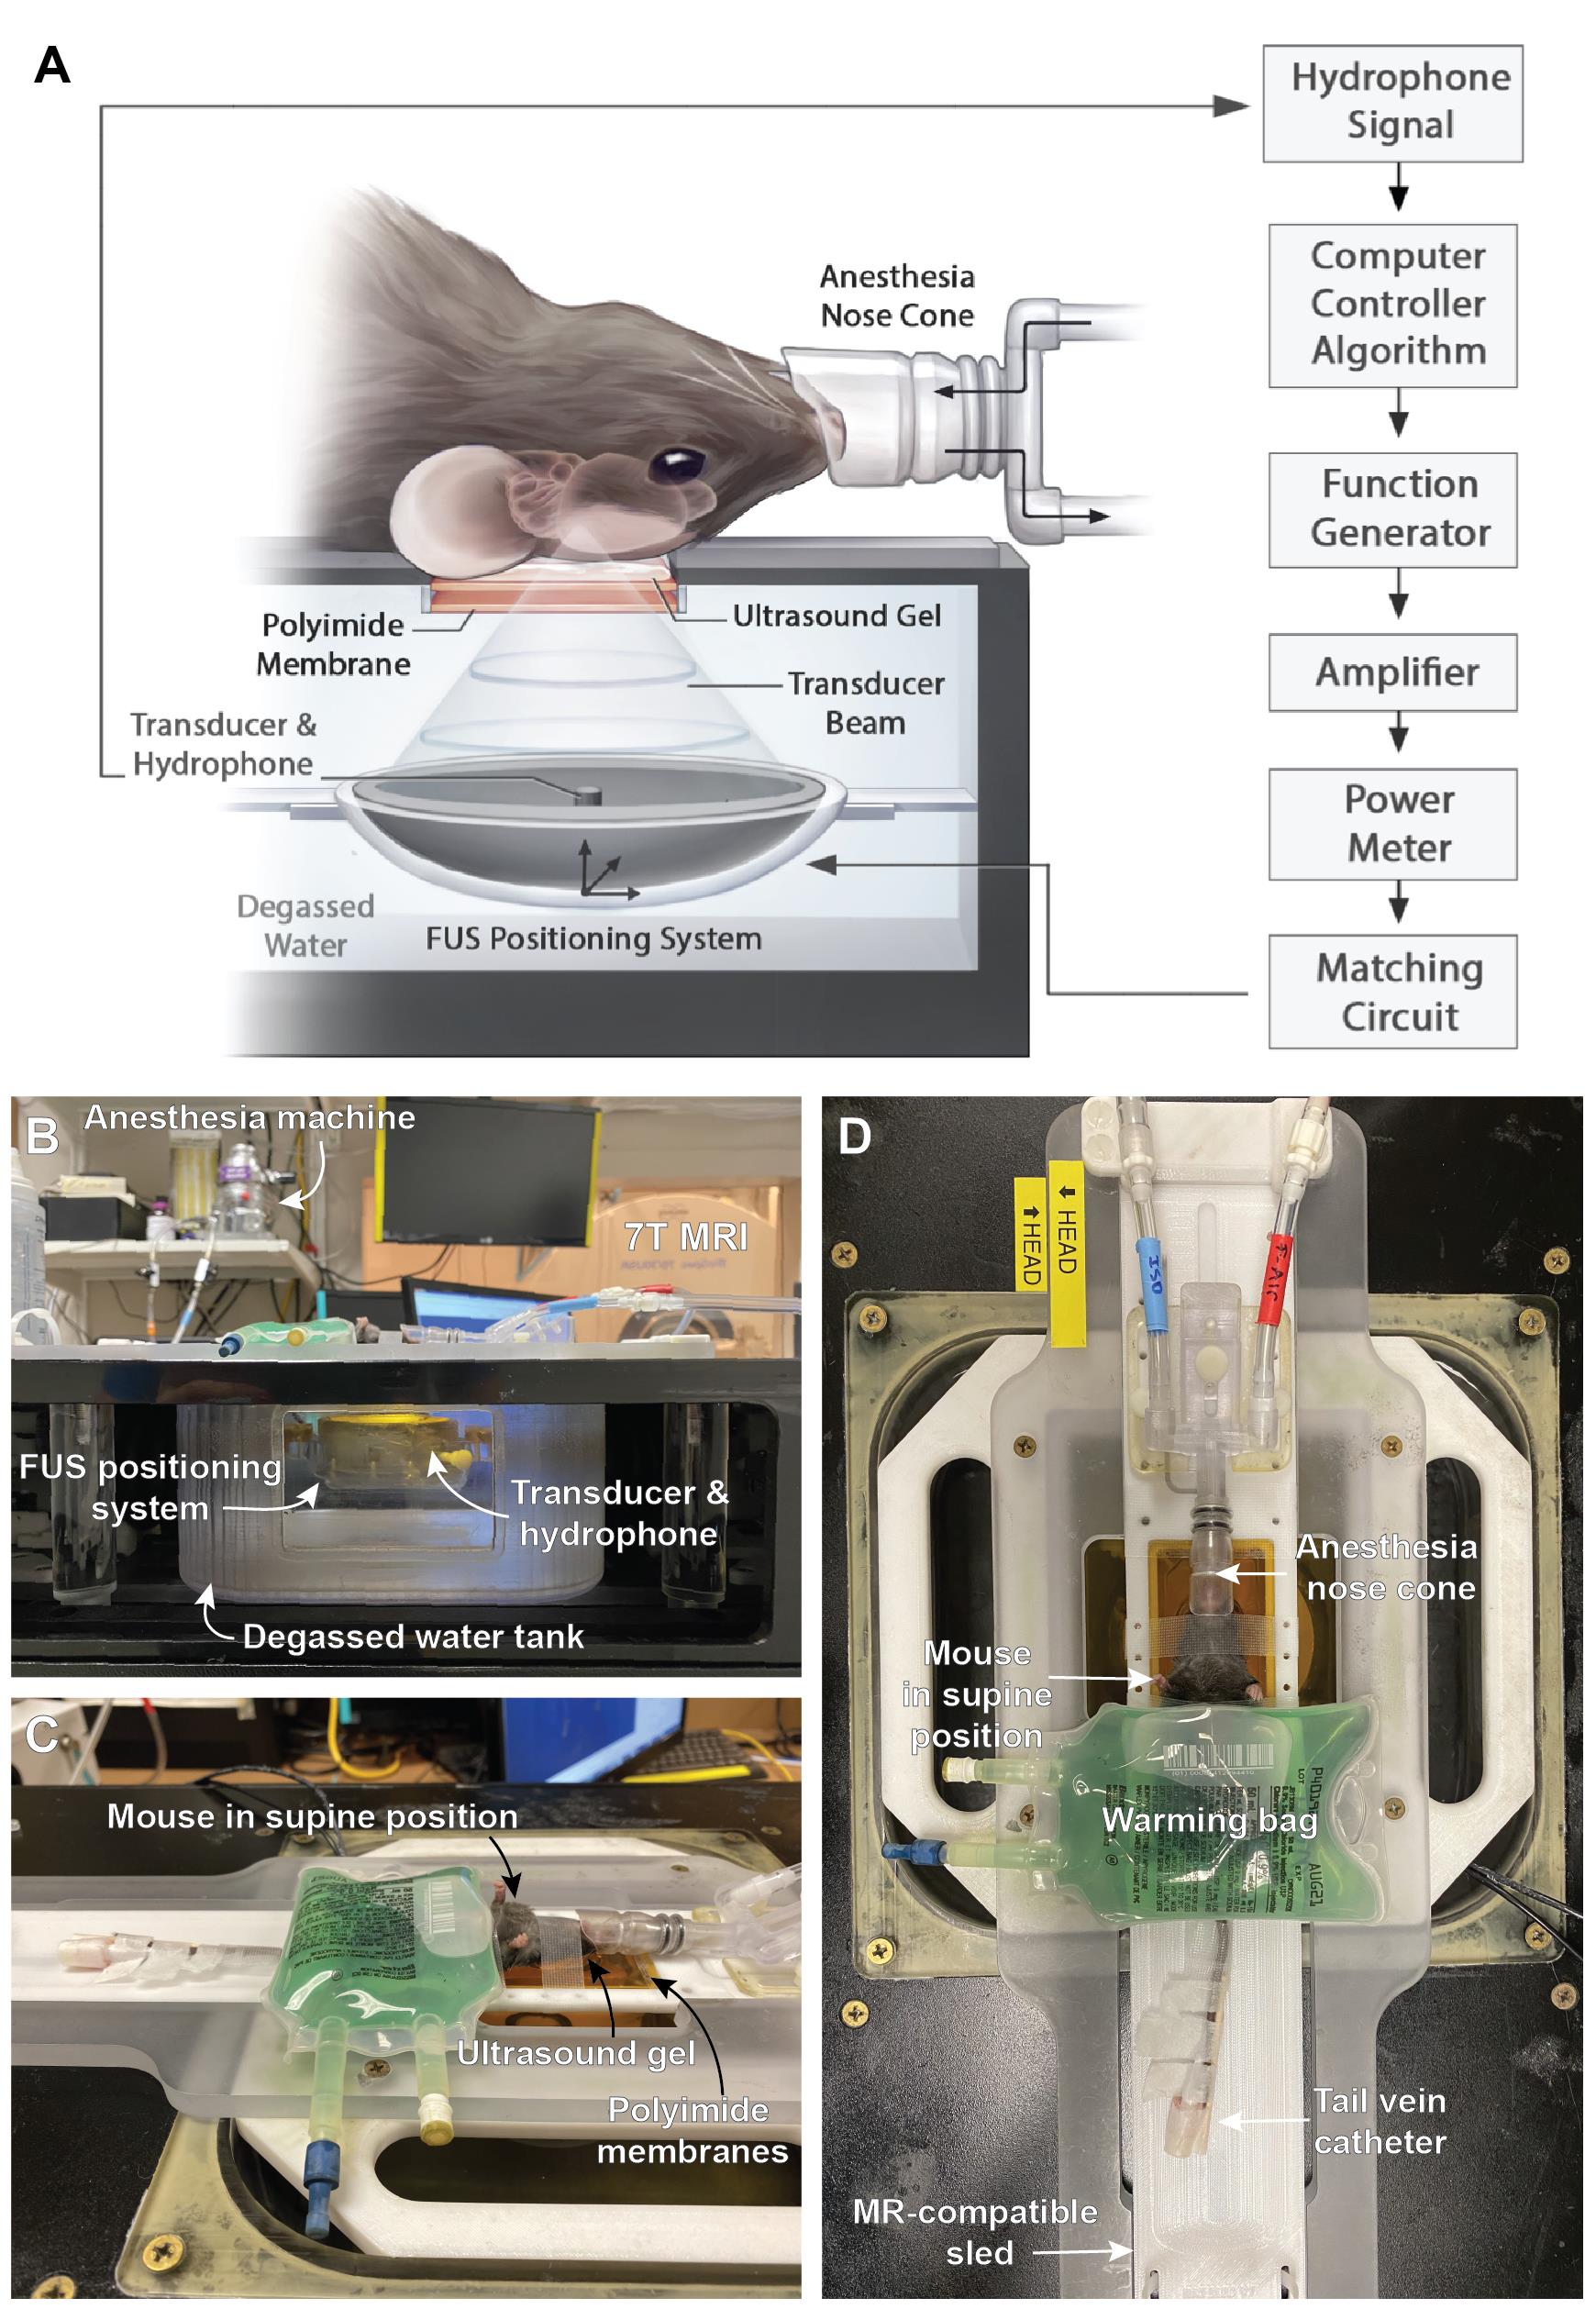
Figure 1. LP100 setup for FUS exposure. (A) Schematic of system components for FUS-mediated BBB permeability enhancement. From Xhima et al. (2020). © The Authors, some rights reserved, exclusive licensee AAAS. Distributed under a CC BY-NC 4.0 License. (B) Side view and (C-D) top views of the experimental setup.
Mouse preparation
Administer 0.5 ml of saline subcutaneously the day prior to the experiment and approximately 45 min pre-sonication to ensure adequate hydration for tail vein catheter placement.
The mouse must be warmed to dilate the tail vein for successful catheterization. Pre-warm the home cage under a forced-air warming blanket at 38°C for approximately 30 min prior to anesthesia and keep the mouse on a warm water pad while anesthetized during catheterization.
Use aseptic technique for tail vein catheterization in a Class IIA2 biosafety cabinet.
Place the mouse in an induction chamber and anesthetize using isoflurane (5%) with oxygen carrier gas (flow rate = 1 L/min).
When the animal is anesthetized, remove it from the induction chamber and gently fit the nose cone. Set the isoflurane vaporizer to 2% (or dose to effect).
Apply lubricant eye ointment to prevent the eyes from overdrying. Re-apply as needed.
Clean the tail with an alcohol prep pad.
Prime a 26 G angiocatheter with heparinized saline, then insert it into the tail vein. Remove the guiding needle from the catheter and secure the catheter injection cap.
Flush heparinized saline through the catheter to confirm correct placement within the tail vein. Back pressure indicates improper placement.
Add structural support to the catheter by securing a rigid structure along the long axis of the tail (e.g., the narrow wooden dowel of a cotton-tipped applicator) with medical tape.
Remove fur on the dorsal surface of the head (from the eye line to the neck) with an electric hair trimmer and depilatory cream.
Wash the depilatory cream with mild detergent and warm water. Wipe the skin with gauze and an alcohol swab.
Determine the body weight of the mouse to calculate the volume of injectables.
MRIgFUS-mediated BBB permeability in the basal forebrain
An experimental timeline of the procedure is illustrated in Figure 2A.
Apply ultrasound gel to the Kapton polyimide window on the MR-compatible sled and position the anesthetized mouse in the supine position on the sled. Ensure there is an unobstructed path for the ultrasound to propagate from the transducer, through the Kapton polyimide window, to the murine brain. Attach the nose cone to plastic tubing connected to the anesthesia machine using isoflurane (1-1.5% or dose to effect) with medical air carrier gas (flow rate = 1 L/min). Secure the head to the MR-compatible sled with medical tape to minimize movement during the procedure. Movement of the head during the procedure will reduce the accuracy of FUS targeting.
Cover the body of the mouse with a heated saline bag to maintain core temperature during the procedure (see Figure 1D).
Place the mouse secured on the sled into the MRI scanner and acquire images of the brain for target planning (tripilot, axial T1-weighted, and axial T2-weighted sequences; see Figure 2B and 2C). In Xhima et al. (2020), RARE T1-weighted images were obtained with TE/TR = 10 ms/500 ms, RARE factor = 2, averages = 3, slice thickness = 1.5 mm, number of slices = 5, and in-plane resolution = 0.25 × 0.25 mm. RARE T2-weighted images were obtained with TE/TR = 75 ms/4,000 ms, RARE factor = 10, averages = 4, slice thickness = 1.5 mm, number of slices = 5, and in-plane resolution = 0.25 × 0.25 mm.
In the FUS Instruments software, select target spots in the basal forebrain from the T2-weighted scan (Figure 2B). The medial septum/vertical diagonal band of Broca (MS/VDB) are targeted with one focal spot. The nucleus basalis/horizontal band of Broca (NBM/HDB) are targeted with two focal spots. The lateral ventricle is used as the MRI-visible anatomical landmark to position the medial focal spot on the appropriate axial MR image. The lateral foci are positioned according to the stereotaxic coordinates from a mouse neuroanatomical atlas (Paxinos and Franklin, 2012).
Position the sled on the FUS system. Perform the sonication using the following FUS parameters: 1.68 MHz frequency, 10 ms burst length, 1 Hz pulse repetition frequency, 120 s duration, and 1% duty cycle. The parameters for passive cavitation detection are 20 MHz sampling rate and 800 mV input range. An acoustic feedback control algorithm, similar to the one described by O’Reilly and Hynynen (2012), is used to calibrate peak negative pressure (PNP) based on the in vivo microbubble response. In brief, starting PNP is set to 250 kPa (measured in water without skull attenuation) and increased incrementally every second by 25 kPa. Definity microbubbles are delivered 10 s following the start of sonication to collect baseline acoustic emissions. Once the magnitude of acoustic emissions at 0.5ƒ passes 3.5 times the baseline level at each target, the sonicating pressure is dropped by 75% and maintained at this level for the remainder of the sonication.
To prepare Definity microbubbles, allow the vial to reach room temperature prior to activation. Shake the Definity vial in the Vialmix device for 45 s. Use a blunt-fill 18 G needle with a 1 ml syringe to slowly draw 0.5 ml of microbubbles from the vial. Immediately before sonication, add 0.02 ml of microbubbles to 0.98 ml saline in a 1 ml syringe and gently combine until evenly mixed. Use a blunt-fill 18 G needle to slowly inject 1 ml/kg of the microbubble dilution through the tail vein catheter 10 s after the sonication begins, then inject a 0.15 ml saline flush.
Inject the desired therapeutic agent, followed by a 0.15 ml saline flush through the catheter immediately after the burst that triggers subharmonic emissions so that the first pass of the drug enters the focal volume following BBB permeability enhancement.
Prepare a dilution of Gadovist with 0.1 ml of Gadovist in 0.9 ml of saline in a 1 ml syringe. Inject 1ml/kg of the diluted solution, followed by a 0.15 ml saline flush.
Position the sled into the MRI scanner and acquire images with a T1-weighted sequence (Figure 2D).
Return the mouse to the procedure room to remove the tail vein catheter. Press the puncture site with gauze until the bleeding stops. Depending on the experimental timeline, mice should be sacrificed immediately or recovered from anesthesia.
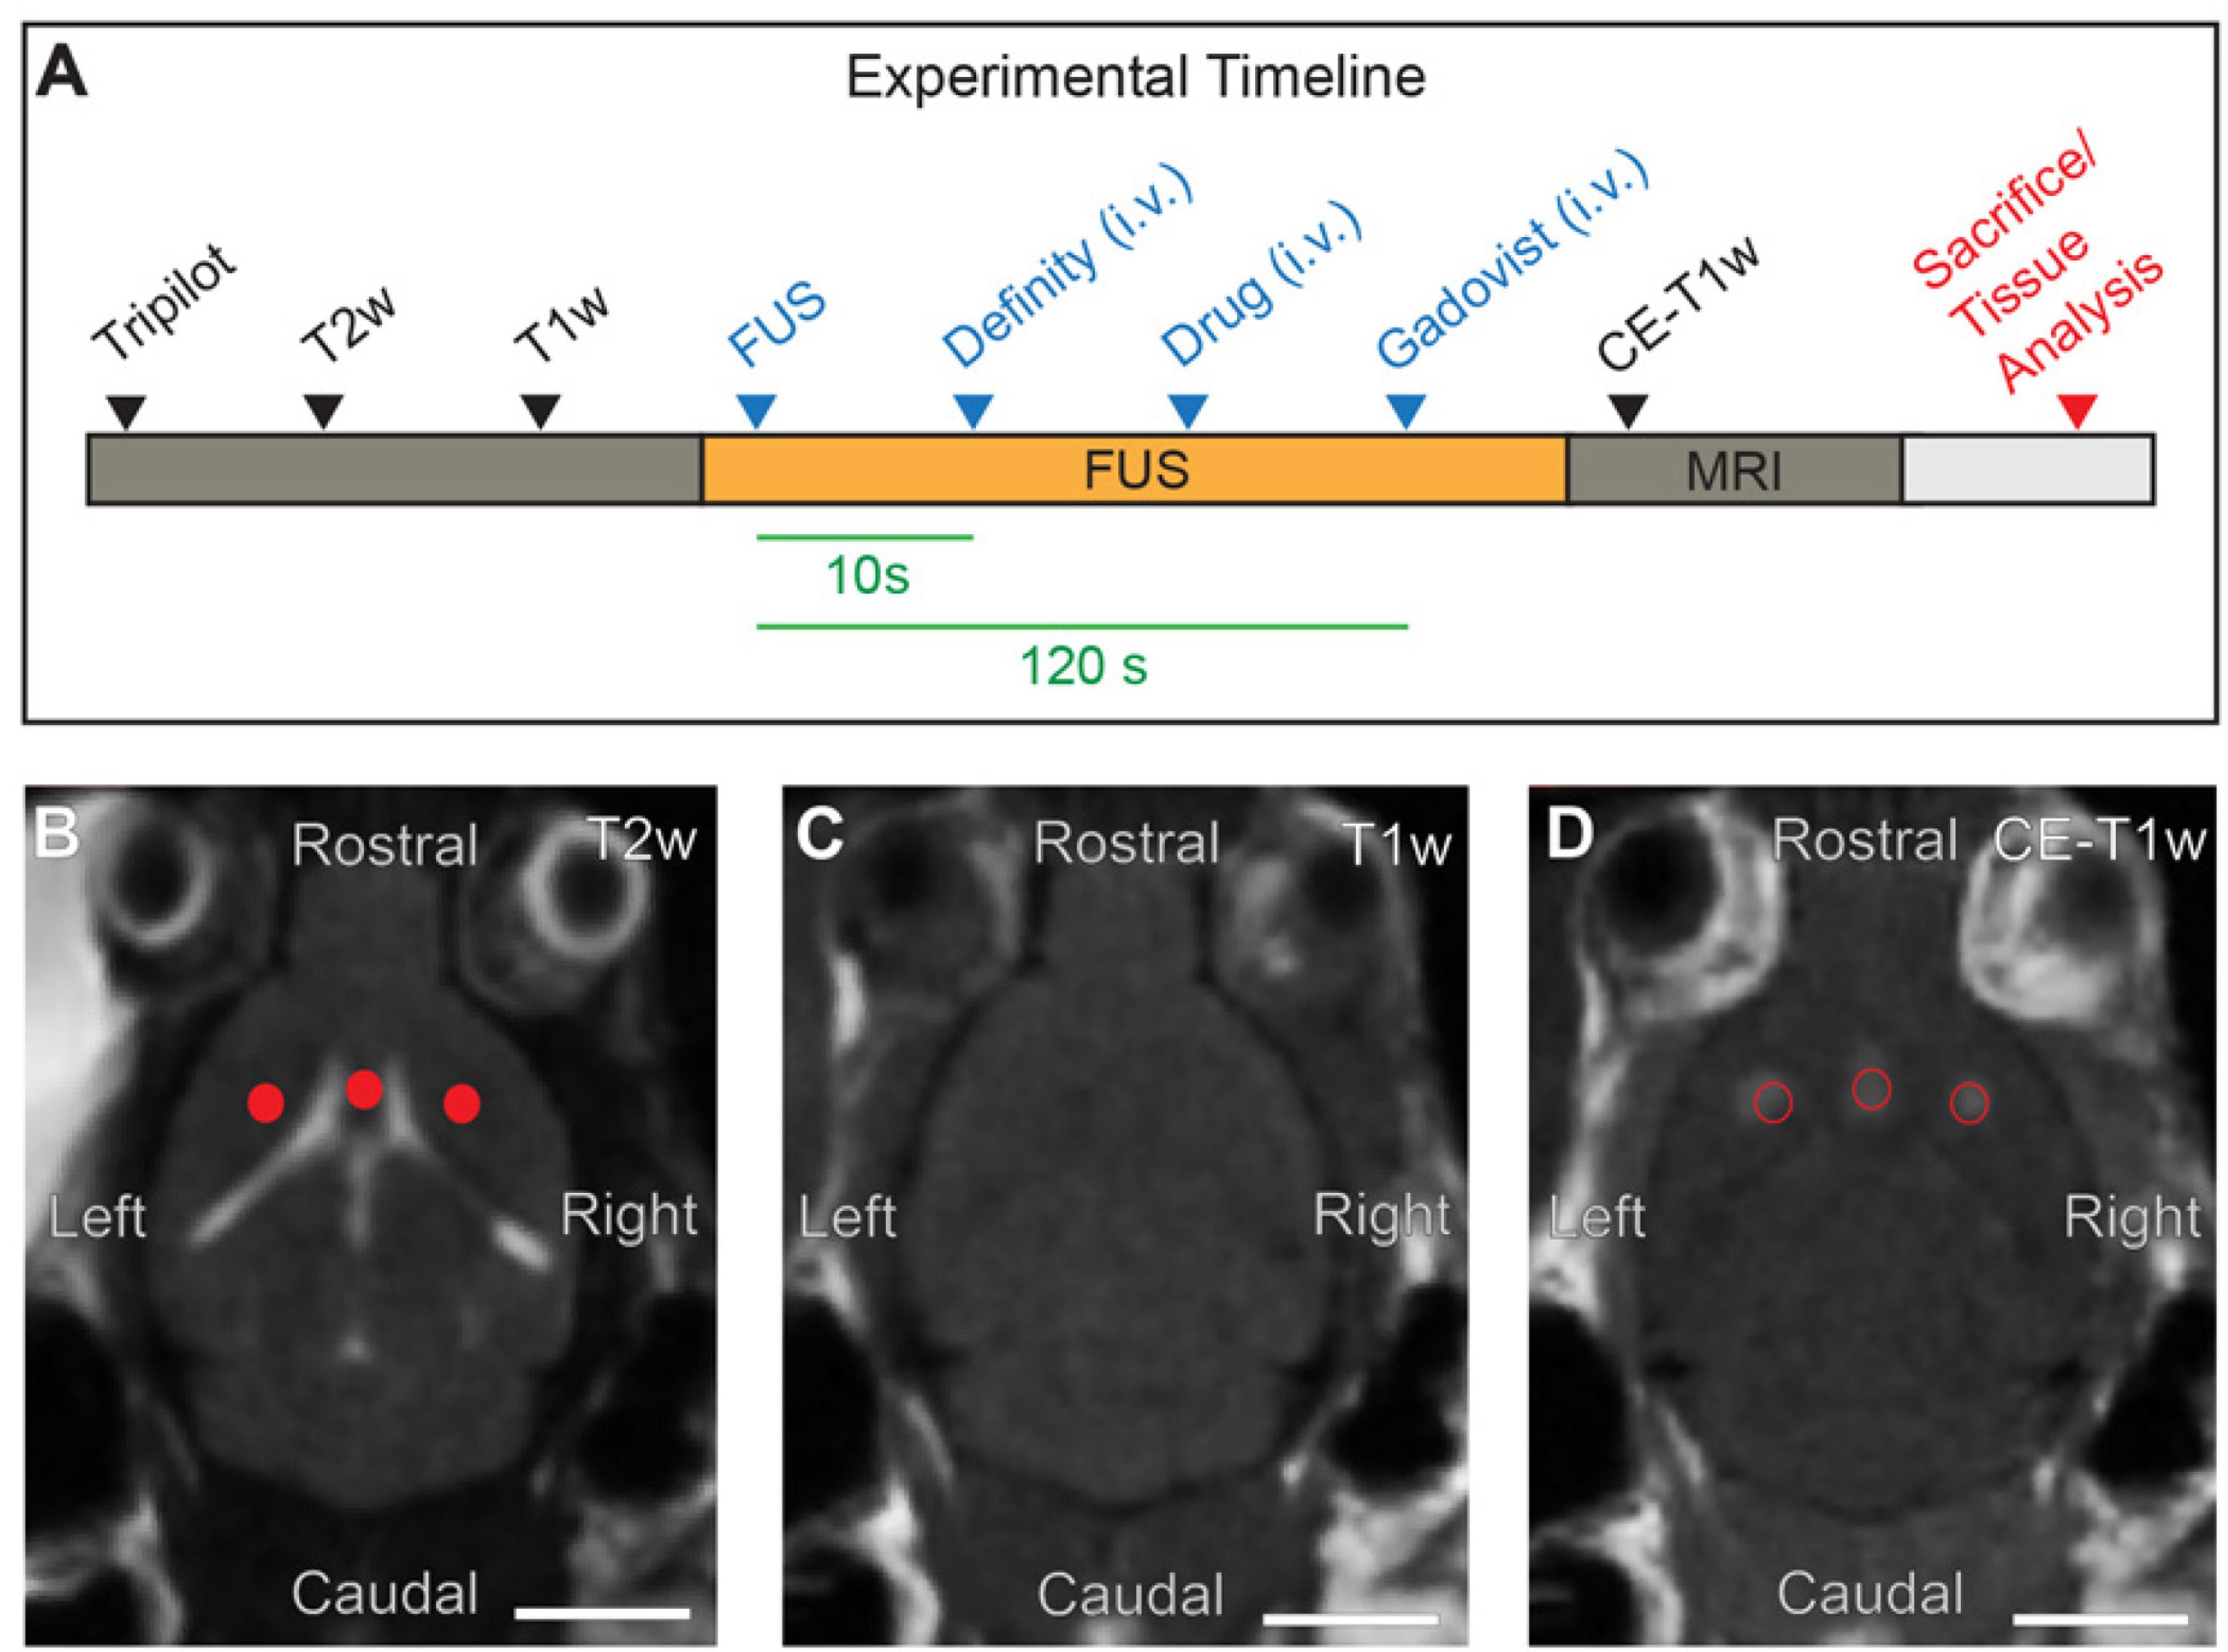
Figure 2. Experimental setup of MRIgFUS targeted to the basal forebrain. (A) Timeline of the experimental procedure, including MRI, FUS exposure, and relevant injectables. (B) FUS target spots are selected in the basal forebrain from T2-weighted (T2w) MR images (red dots). (C) T1-weighted (T1w) MR images collected prior to FUS exposure. (D) Enhanced BBB permeability in FUS-targeted areas visualized on contrast-enhanced T1w (CE-T1w) MRI as regions of increased signal intensity (red circles). Scale bars (B-D), 5 mm.
Data analysis
Several analyses can be performed to assess MRIgFUS-induced BBB permeability enhancement and drug delivery in the basal forebrain. Considerations for the distribution and degree of BBB permeability across experimental conditions represent important controls for drug delivery; that is, FUS-mediated BBB modulation itself allows penetration of endogenous factors from the blood, which induce bioeffects that may impact the interpretation of outcome measures associated with drug safety and efficacy. We summarize common analysis methods for BBB permeability following MRIgFUS in this section.
In vivo assessment of BBB modulation by contrast-enhanced MRI. BBB permeability in FUS-targeted foci can be assessed by voxel-wise intensity changes on contrast-enhanced T1-weighted MR images acquired following intravenous injection of a gadolinium-based MRI contrast agent. Regional-based analysis of MRI contrast enhancement following FUS treatment can reveal the degree of increased BBB permeability in FUS-targeted structures and adjacent, non-targeted brain areas. In Figure 3, we present an automated regional-based analysis of enhancement in a sample dataset using a computational pipeline that performs intensity-based and multi-scale image registration to the Allen Mouse Brain Reference Atlas (ARA) (https://miracl.readthedocs.io; Goubran et al., 2019). Due to the limited number of slices in the Z-dimension of the MRI scans, we perform a slice-level registration in lieu of whole-brain 3D mapping (Figure 3A). A manual initialization step is required whereby the corresponding section from the ARA is chosen to limit the target search of the registration algorithm (Figure 3B). Pre-processing steps include bias-field correction using the N4 algorithm (to eliminate inhomogeneities), cropping of the field of view, and skull stripping to extract the brain prior to the registration. The ARA 50 μm resolution template is employed for registration. To deal with the relatively lower resolution of the MRI scans, a lower depth version of Allen atlas labels is created for analysis by grouping labels based on the atlas ontology and hierarchy, creating ‘grand-parent’ labels (Figure 3B). The registration step consists of an intensity-based b-spline, three-stage registration with increasing degrees of freedom of their transformations, encompassing rigid, affine, and non-rigid (deformable) symmetric normalization stages, each consisting of a multi-resolution approach with four levels. We employ the mutual information similarity metric. The net product of the registration is a transformation that performs bidirectional warping of images to and from the MRI native space and to and from the ARA templates and labels (Figure 3C). We rank the regions by the highest voxel-wise maximum intensity (T1-weighted signal) using warped ARA labels in native MRI space (Figure 3D). This analysis quantitatively confirms FUS targeting and enhancement in the basal forebrain structures, as well as some off-target effects in the dorsal striatum with our single element transducer setup.
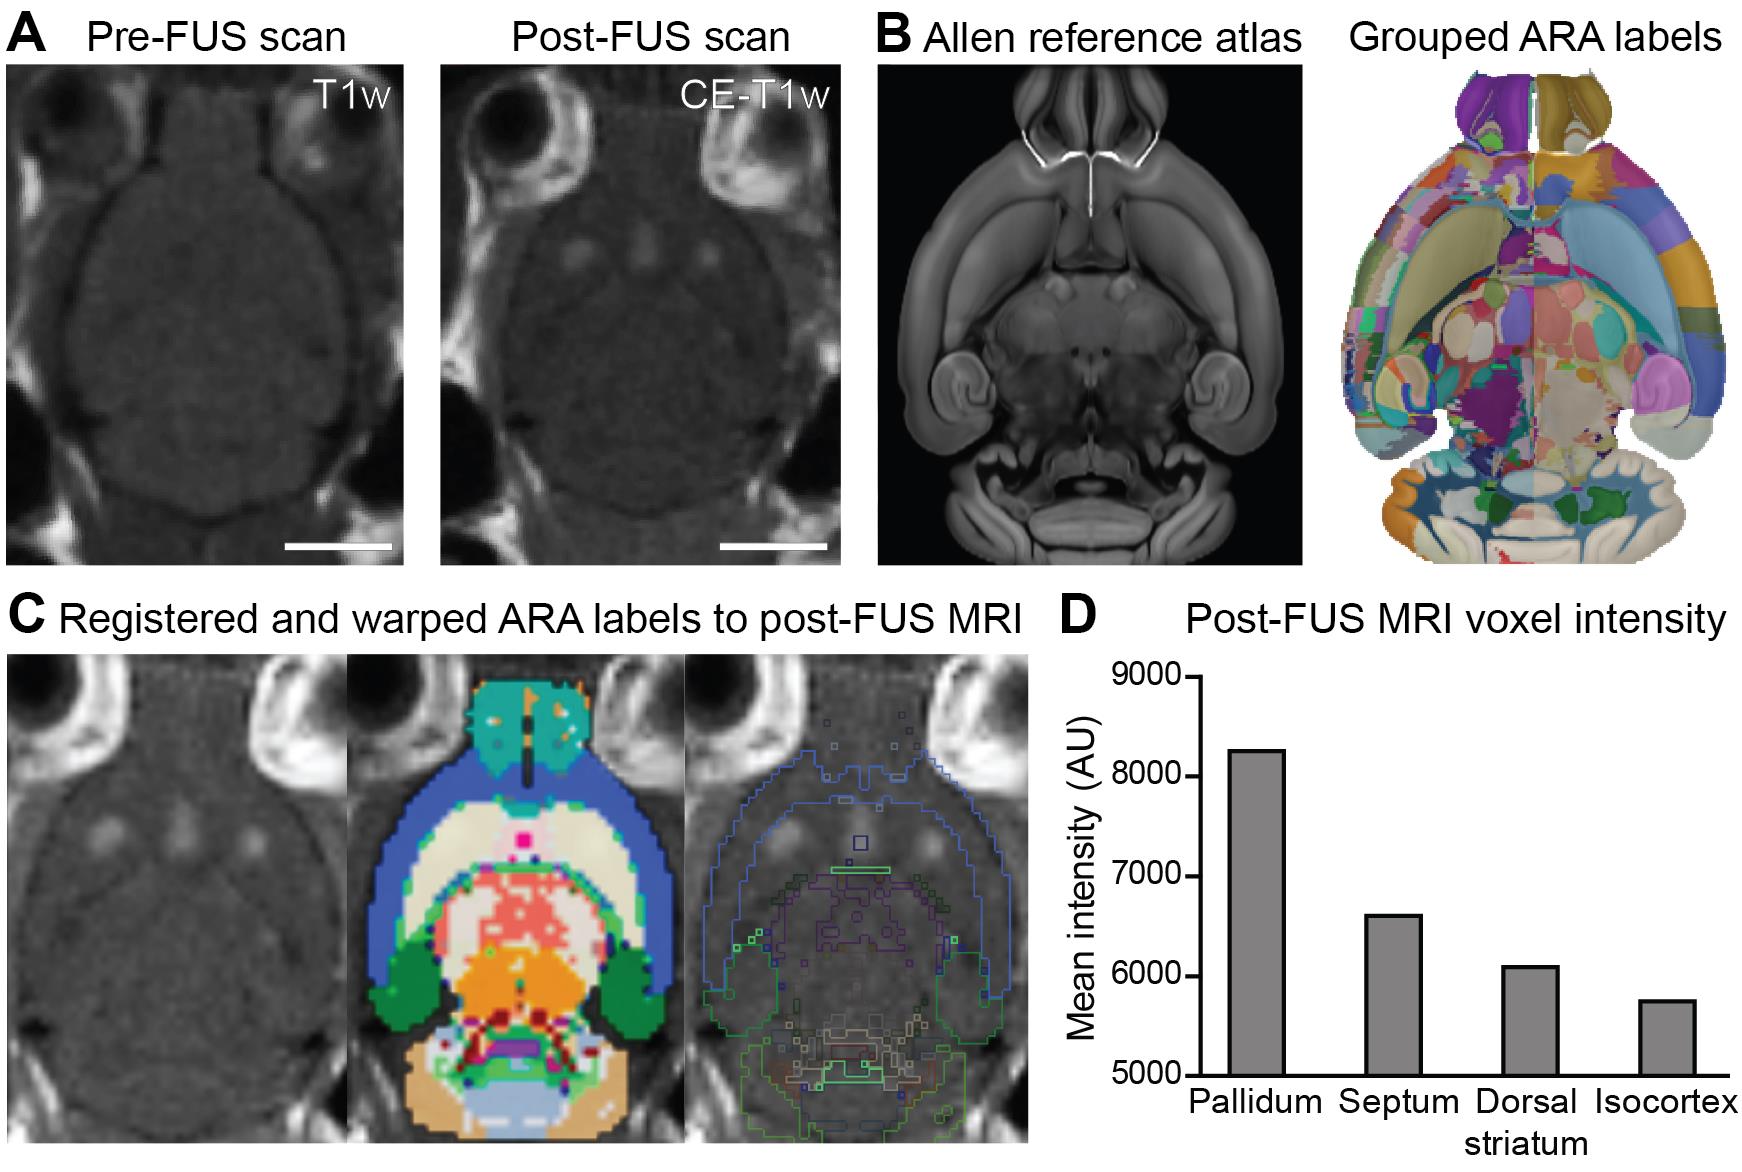
Figure 3. Regional analysis of BBB permeability enhancement in the MRIgFUS-targeted basal forebrain. (A) Axial slices of pre-and post-FUS T1-weighted MR scans. (B) Left: Corresponding axial slice of the ARA 50 μm template used for registration; Right: ARA labels with the left hemisphere showing the original labels and the right hemisphere highlighting grouped ‘grand-parent’ labels at a lower depth used for MRI analysis. (C) ARA labels registered to the post-FUS MRI scans and warped to the native MRI space. (D) Mean MRI intensity within brain regions with contrast enhancement, including basal forebrain structures, dorsal striatum, and isocortex. Scale bars (A and B), 5 mm.Correlation between drug delivery and contrast-enhanced MRI. In Xhima et al. (2020), the increase in signal intensity on contrast-enhanced T1-weighted images following FUS was linearly correlated with the concentration of a small-molecule drug (~600 Da) delivered to the basal forebrain. However, specific drug properties (e.g., molecular weight, hydrophilicity, charge, and plasma half-life) may affect the degree of drug extravasation (Marty et al., 2012); thus, the correlation between contrast agent concentration and drug concentration must be estimated for each therapeutic. Dynamic contrast-enhanced (DCE) imaging, combined with pharmacokinetic modeling, has also been applied to capture the dynamics of BBB permeability and represents another predictive tool for estimating drug delivery following FUS (Park et al., 2017).
Biochemical and/or histological evaluation of BBB permeability enhancement. Changes in BBB permeability can be assessed by examining the extravasation of blood proteins (i.e., albumin, fibrinogen, IgM, and IgG) or exogenous tracers introduced into the bloodstream in FUS-targeted brain tissue. In Xhima et al. (2020), Evans blue dye, which binds to serum albumin (66.5 kDa), was administered intravenously, and labeling in the brain was subsequently evaluated by immunohistochemistry (Figure 4). Please refer to Xhima et al. (2020) for tissue processing, immunohistochemistry, and image acquisition procedures related to the histological analyses in Figure 4. Evans blue dye extravasation can also be measured with an optical imaging assay (Yang et al., 2012). Dyes with a low binding affinity for serum proteins (e.g., dextran amines coupled to biotin or fluorophores) are smaller than endogenous tracers and may reveal more subtle changes in BBB permeability (Marty et al., 2012).
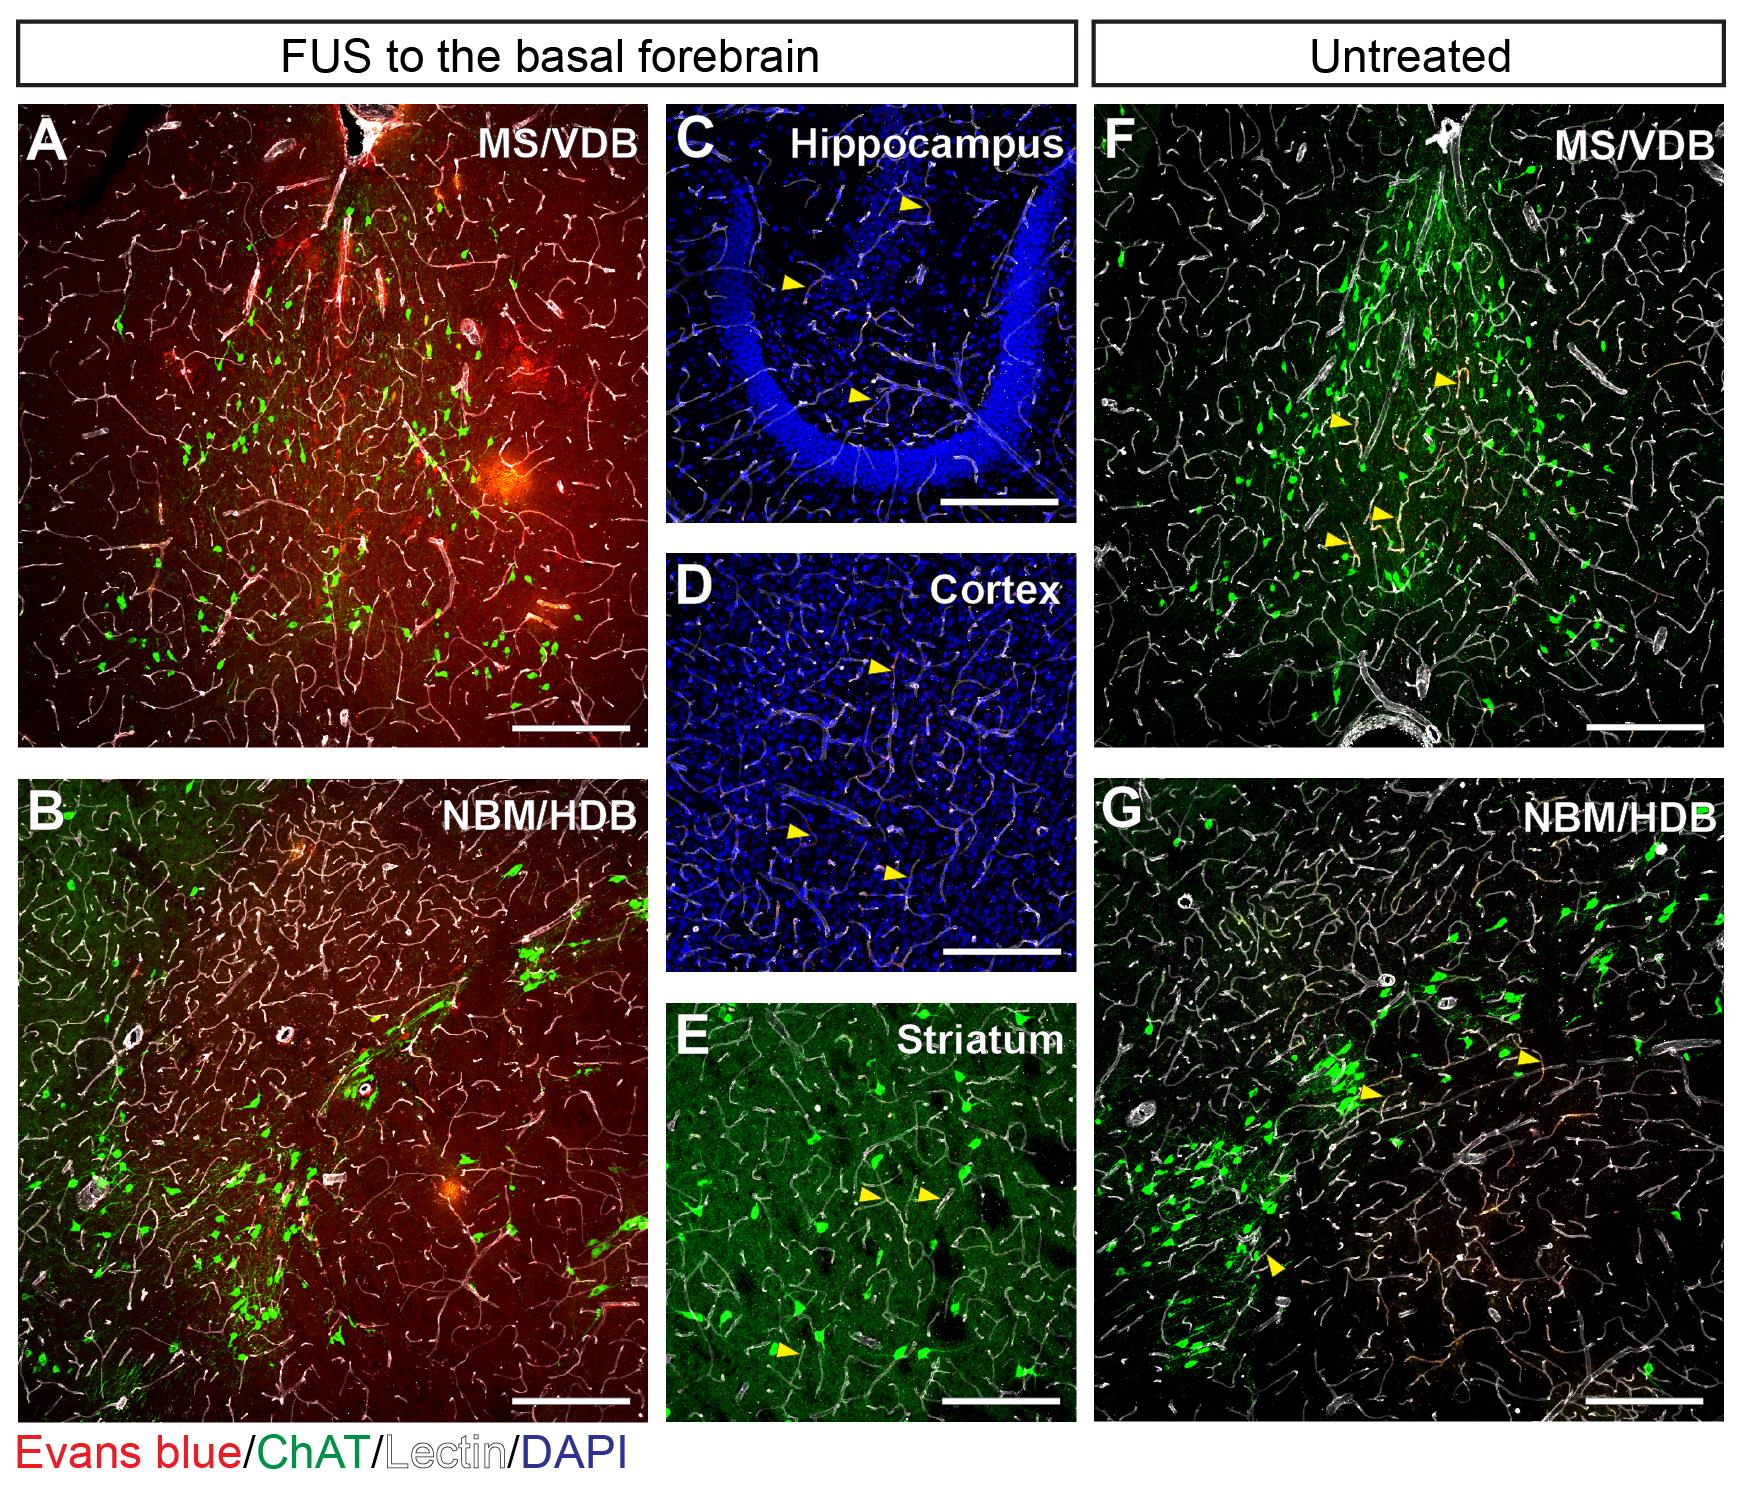
Figure 4. Histological assessment of MRIgFUS-induced BBB permeability enhancement localized to the basal forebrain. (A-E) Extravasation of Evans blue-bound albumin (red) was detected in brain parenchyma of the FUS-targeted MS/VDB (A) and NBM/HDB (B) but absent in the adjacent brain regions of FUS-treated mice, including the hippocampus (C), cortex (D), and striatum (E) where Evans blue-bound albumin was restricted within blood vessels (white). (F-G) Similarly, in mice that received Evans blue (without FUS) intravenously, Evans blue-bound albumin was confined to the vasculature in the MS/VDB (F) and NBM/HDB (G). Yellow arrows in panels C-G indicate examples of Evans blue-bound albumin co-localized within blood vessels. Choline acetyltransferase (ChAT, green) was used to visualize cholinergic cell bodies. Scale bars (A, B, F, G), 20 μm and (C to E), 100 μm.Analysis of acoustic emissions data acquired during FUS. Oscillating microbubbles during FUS exert direct forces on the vascular walls that contribute to changes in BBB permeability. The spectral content of acoustic emissions originating from oscillating microbubble in vivo can thus provide insight into the nature of FUS-induced BBB permeabilization. Acoustic emissions during sonication can be assessed to ensure consistent BBB permeability enhancement across test subjects and to control for the bioeffects associated with FUS-induced BBB modulation that may affect outcome measures associated with drug safety and efficacy. In Figure 5, we present a typical analysis of acoustic emissions related to MRIgFUS-mediated delivery of a small molecule, D3, to the basal forebrain. The peak magnitude of 0.5ƒ, ƒ, 1.5ƒ, 2ƒ, and wideband emissions from a single burst during the sonication are presented in Figure 5. Analysis of the exposure-average magnitude of acoustic emissions may also be informative. Hydrophone signals were analyzed as previously described (McMahon et al., 2020). Additionally, subharmonic emissions collected during FUS exposure form the basis of the acoustic feedback control strategy used to calibrate PNP during the sonication. We direct the reader to Xhima et al. (2020) for an example of pressure analyses related to FUS-mediated delivery of compound D3 to the basal forebrain.
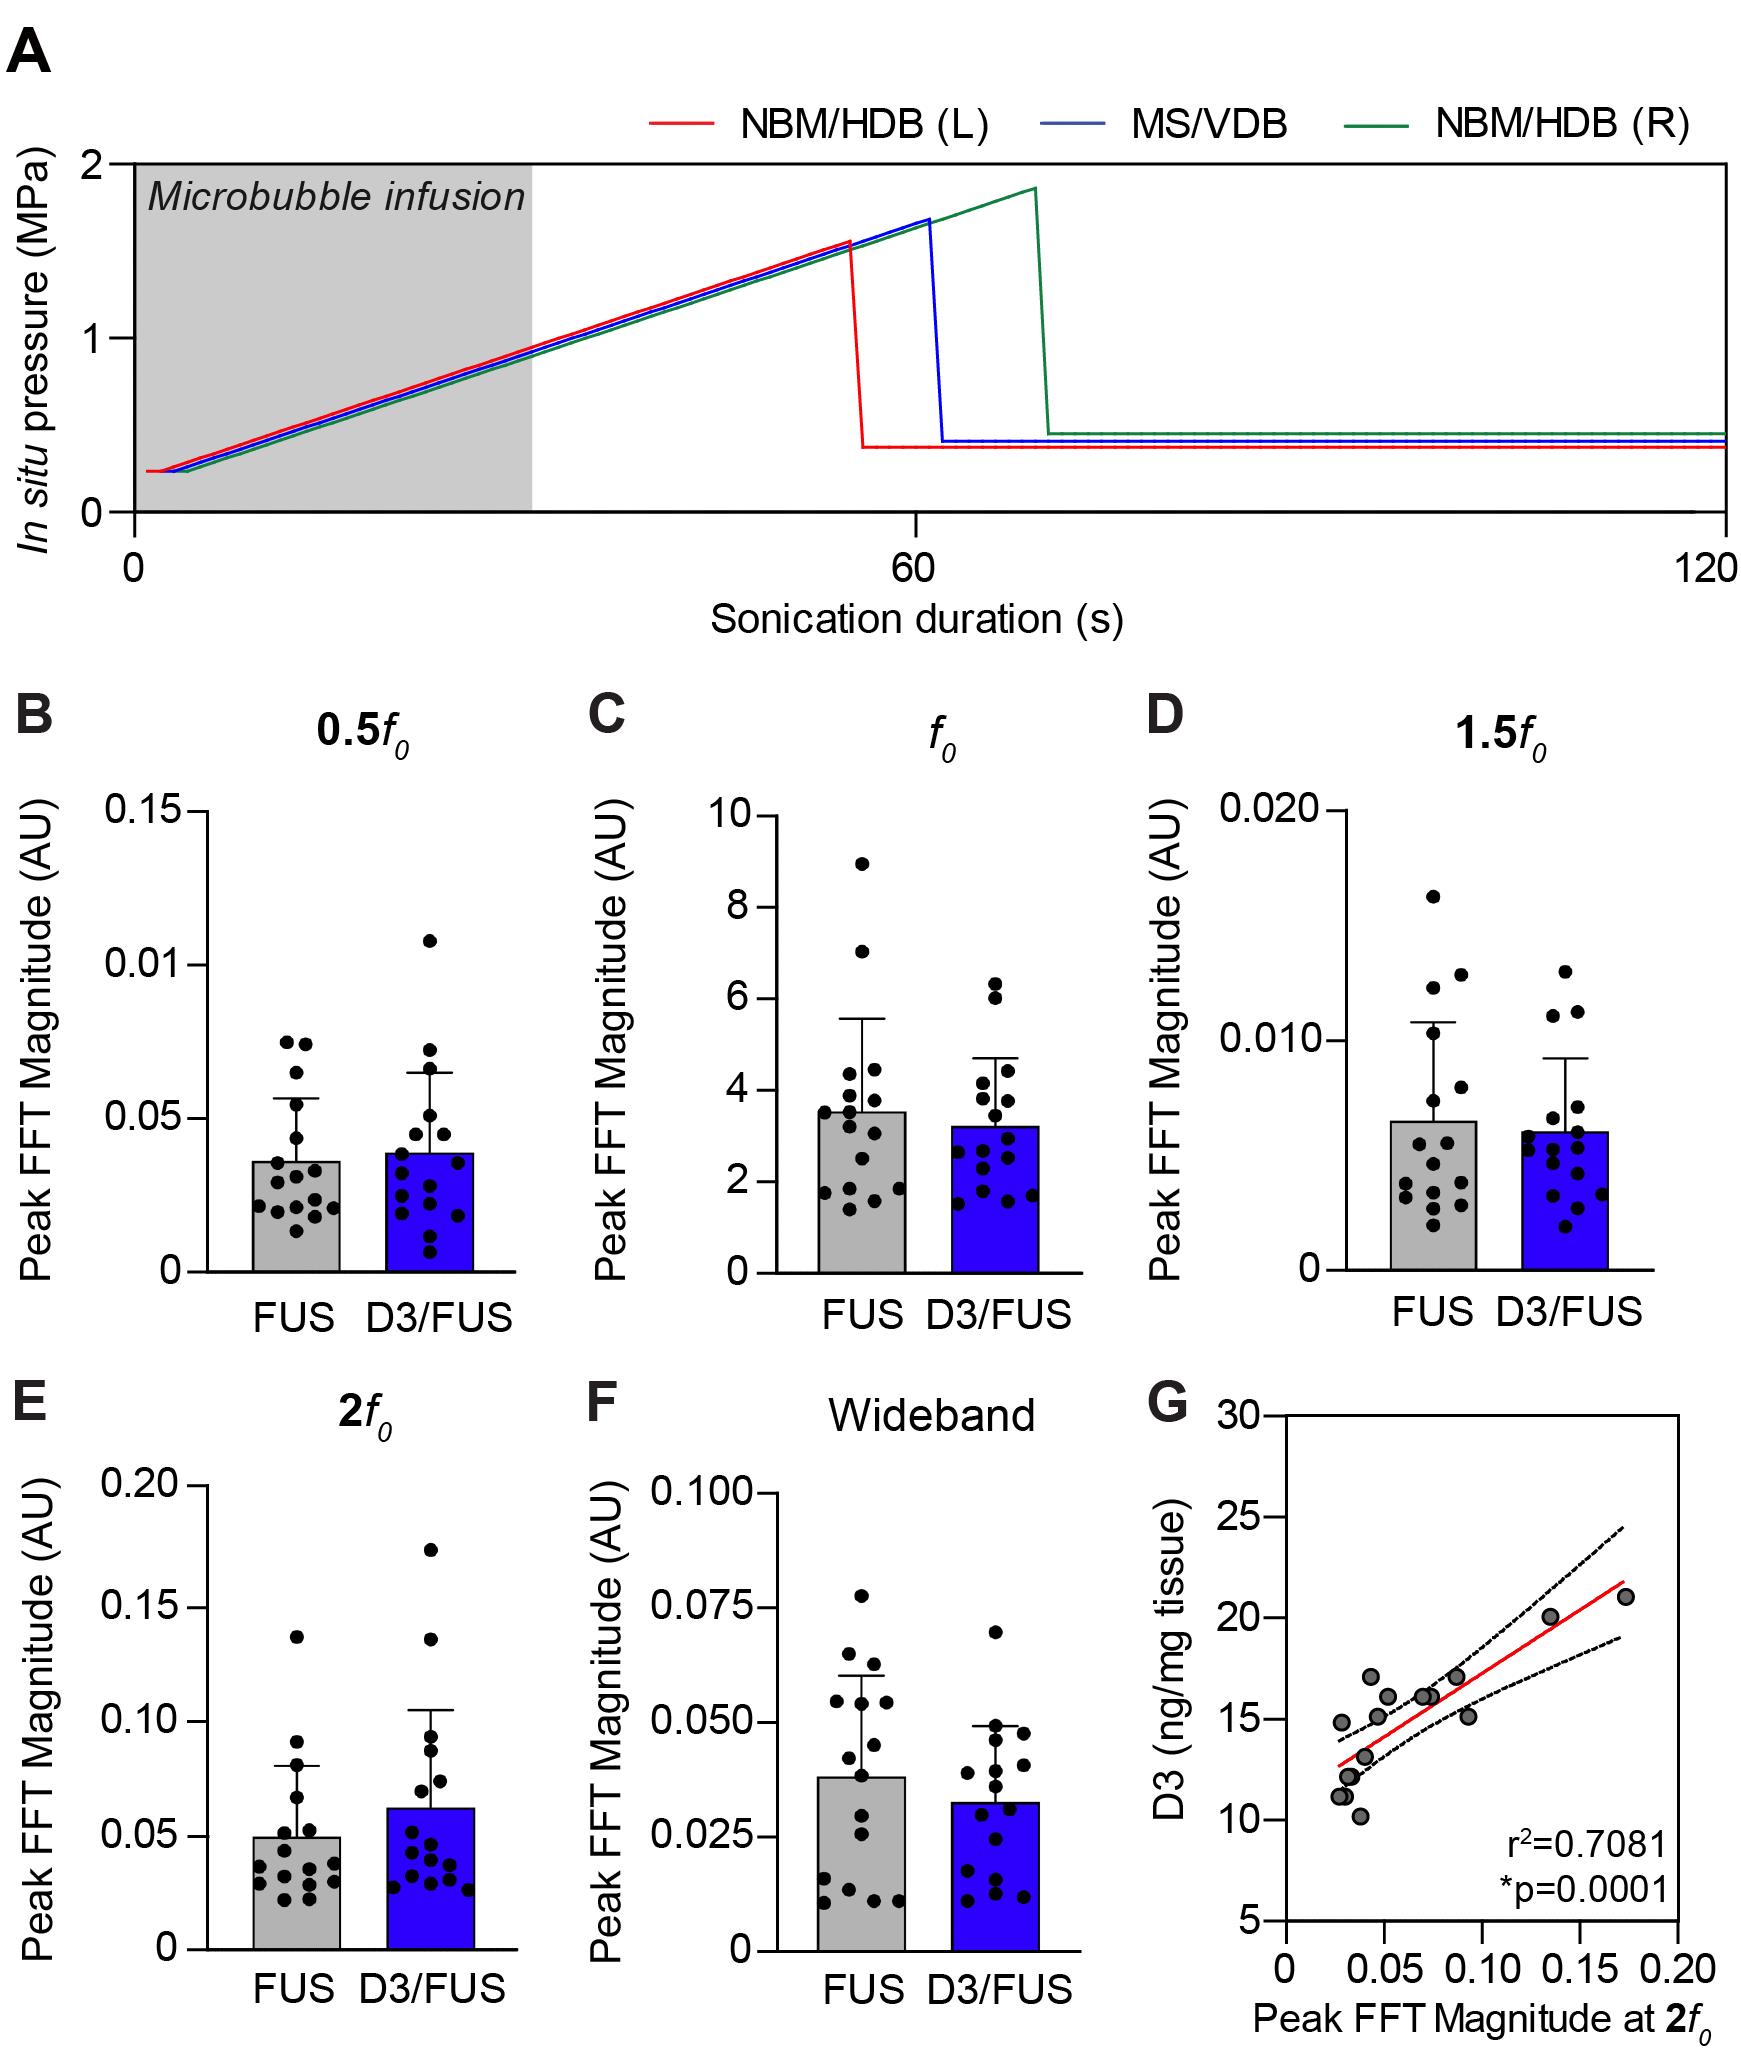
Figure 5. Analysis of acoustic emissions acquired during FUS exposure. (A) For mice, the acoustic emissions feedback control algorithm is set at a starting pressure of 250 kPa and increased incrementally by 25 kPa with each subsequent burst until subharmonic emissions are detected. The applied pressure is then reduced to 25% of the pressure at which subharmonic emissions were detected and set at that level for the remainder of sonication. (B-F) Spectral analysis of mean acoustic emissions in FUS-treated controls (i.e., intravenous saline, MRIgFUS to the basal forebrain) and D3/FUS-treated mice (i.e., intravenous D3, MRIgFUS to the basal forebrain). D3 refers to the small-molecule TrkA agonist delivered with FUS as in Xhima et al., 2020. (G) The peak magnitude of 2ƒ0 emissions across sonication targets exhibited a strong linear correlation with drug delivery in the basal forebrain.Assessment of central and peripheral inflammation and/or tissue injury following FUS-mediated drug delivery. There is ongoing concern over the neuroinflammatory response and potential tissue damage triggered by BBB permeability enhancement from oscillating microbubbles (Kovacs et al., 2017; McMahon and Hynynen, 2017; McMahon et al., 2020), particularly in the disease state. Histological analysis of necrosis, apoptosis, hemorrhage, and inflammation is warranted after FUS-mediated drug delivery. Further potential peripheral side effects associated with intravenous drug delivery should be investigated as part of the overall drug safety profile.
Notes
For long-term experimental endpoints after FUS-mediated drug delivery, follow institutional animal use protocols, guidelines, and regulations for animal recovery from anesthesia.
FUS, in combination with intravenously injected microbubbles, can be used to deliver a wide range of therapeutic agents, including antibodies, proteins, nanoparticles, viral vectors, and cells, to targeted brain areas (Meng et al., 2020). Biologics can be injected into the bloodstream along with microbubbles or can be encapsulated within or linked to the microbubble shell to enhance delivery (Meng et al., 2020). When a therapeutic agent is administered in combination with FUS, interactions may take place that synergistically or antagonistically modify the effect of the given agent. Thus, for compounds that require repeated dosing, preliminary pharmacological experiments are encouraged, including a dose-response study with at least three dose levels and measurement of pharmacokinetic properties with FUS delivery.
The maximum volume of all intravenous injectables (i.e., Definity, Gadovist, saline, and therapeutic agent) should not exceed 25 ml/kg of body weight during the sonication. To minimize the dosing variability resulting from injection through the catheter hub, the volume to be administered should be 20 μl or greater. Additionally, the solution properties of the therapeutic agent (e.g., tonicity and pH) should also be considered when determining the volume to be administered intravenously.
The most suitable FUS parameters and regimes of acoustic cavitation, tuned to the properties of a given therapeutic agent, require individualized investigation. The FUS parameters and acoustic feedback control algorithm described in this protocol led to extravasation of large serum proteins, including Evans blue-bound albumin (66.5 kDa) and endogenous IgG (150 kDa) and IgM (970 kDa), albeit with different distributions around permeabilized vessels (Xhima et al., 2020).
Monitoring systems to improve safety and to minimize variability in the bioeffects and treatment efficacy of BBB opening within and across test subjects represent a significant advance towards clinical translation. Here, we implement an acoustic feedback control strategy based on subharmonic emissions generated by oscillating microbubbles (O’Reilly and Hynynen, 2012). Alternative strategies for cavitation monitoring and real-time control of BBB modulation with FUS are also under investigation (Sun et al., 2017; Jones et al., 2018).
In previous clinical trials, bilateral delivery of AAV2-NGF vectors to the NBM was achieved via six separate injections with limited therapeutic distribution from the individual sites of injection (Tuszynski et al., 2005 and 2015; Castle et al., 2020). Targeting the NBM with FUS would be a significantly faster procedure with all focal spots permeabilized in a single sonication. Additionally, relative to intracranial injections, increased drug distribution covering the entire basal forebrain can be accomplished using FUS by targeting multiple focal spots in the same sonication scheme.
We use the LP100 (FUS Instruments, Inc.) in this protocol as described in Xhima et al. (2020). The LP100 can be operated outside the MRI room, as we have done here, or fitted in a clinical MRI scanner. The RK300 (FUS Instruments, Inc.) is designed to perform the sonication inside the small-bore MR system. The RK50 (FUS Instruments, Inc.) uses stereotaxic guidance, rather than MR imaging, for target selection.
For safe and effective clinical translation of FUS-related drug delivery applications, it is important to control for the effects of FUS-induced BBB permeability enhancement in the absence of drug delivery as part of the overall experimental design. Secondary bioeffects linked to FUS-induced permeability of the BBB itself remain to be fully understood and are under active investigation. For instance, transient neuroinflammation, Aβ and tau clearance, alterations in neuronal activity, and elevated neurotrophin levels have all been reported following FUS-mediated BBB modulation (Jordão et al., 2013; Burgess et al., 2014; Leinenga and Götz, 2015; Kovacs et al., 2017; McMahon and Hynynen 2017; McMahon et al., 2020; Meng et al., 2020; Xhima et al., 2020). Thus, we recommend including a control group that receives a drug vehicle solution with identical FUS exposure.
BBB dysfunction can occur following a stroke in cases of Alzheimer’s disease and related dementias, amyotrophic lateral sclerosis, and depression. Prior evidence also supports altered blood-brain transport mechanisms in aging (Yang et al., 2020). Additionally, an elevated degree of central and peripheral inflammation is characteristic of many brain disorders, which may further exacerbate BBB dysfunction (Menard et al., 2017; Abdullahi et al., 2018; Sweeney et al., 2018). In the presence of pathological changes to BBB integrity and inflammation, it is important to consider the resolution of the inflammatory and immune response triggered by FUS-mediated BBB modulation itself; this will ensure the tolerability and safety of the FUS treatment, especially in the context of repeated dosing paradigms.
Experimental groups of mice should be balanced for sex and weight. It is important to consider whether there are sex-dependent differences in pathology and drug response. For instance, a 34% difference between the sexes in the number of cholinergic neurons in the NBM but not the MS/VDB and associated behaviors have been reported in preclinical models of AD (Kelley et al., 2014). In humans, sex-specific differences in the basal forebrain cholinergic system and the benefit of cholinergic-targeted agents have been demonstrated (Giacobini and Pepeu, 2018). Potential sex differences in response to FUS-induced BBB permeability remain to be thoroughly investigated. It is possible that the kinetics of BBB modulation may differ between males and females, particularly in disease states, and thus may require revisiting dosing regimens for drug delivery using FUS.
While the atlas registration was performed on a slice-level due to the limited out-of-plane resolution of our current MRI protocol, a 3D whole-brain registration and subsequent analysis could be achieved using an updated imaging acquisition. Our MRI-ARA registration pipelines were optimized for 3D whole-brain registrations and have been validated on scans with a higher resolution in the Z-dimension (Goubran et al., 2019).
Acknowledgments
This protocol was adapted from Xhima et al. (2020). We thank Kristina Mikloska for MRIgFUS expertise and for acquiring photos of the MRIgFUS setup. This work was supported by the Canadian Institutes of Health Research (grants FRN 137064, 166184, 168906 to I.A., FRN 154272 awarded to K.H.), the Canada Research Chairs Program (I. A. Tier 1 Canada Research Chair in Brain Repair and Regeneration), the National Institute of Biomedical Imaging and Bioengineering of the National Institute of Health (RO1-EB003268 awarded to K.H.), and the Temerty Chair in Focused Ultrasound Research at Sunnybrook Health Sciences Centre (K.H.). Additional funding was received from the FDC Foundation, the WB Family Foundation, Gerald and Carla Connor, and the Weston Brain Institute (TR130117 to I.A.). K.X. was awarded a Frederick Banting and Charles Best Canada Graduate Scholarship (GSD 152271).
Competing interests
K.H. is a co-founder of FUS Instruments, a manufacturer of pre-clinical focused ultrasound devices, from which he receives non-study-related financial support. He is also an inventor on several pending and issued patents related to BBB modulation using ultrasound. The other authors declare no competing interests.
Ethics
All animal procedures were approved by the Sunnybrook Research Institute Animal Care Committee and conducted in accordance with the Canadian Council on Animal Care Policies & Guidelines and the Animals for Research Act of Ontario.
References
- Abdullahi, W., Tripathi, D. and Ronaldson, P. T. (2018). Blood-brain barrier dysfunction in ischemic stroke: targeting tight junctions and transporters for vascular protection. Am J Physiol Cell Physiol 315(3): C343-C356.
- Birks, J. S. and Harvey, R. J. (2018). Donepezil for dementia due to Alzheimer's disease. Cochrane Database Syst Rev 6(9427): CD001190.
- Burgess, A., Dubey, S., Yeung, S., Hough, O., Eterman, N., Aubert, I. and Hynynen, K. (2014). Alzheimer disease in a mouse model: MR imaging-guided focused ultrasound targeted to the hippocampus opens the blood-brain barrier and improves pathologic abnormalities and behavior. Radiology 273(3): 736-745.
- Castle, M. J., Baltanás, F. C., Kovacs, I., Nagahara, A. H., Barba, D. and Tuszynski, M. H. (2020). Postmortem analysis in a clinical trial of AAV2-NGF gene therapy for Alzheimer's Disease identifies a need for improved vector delivery. Hum Gene Ther 31(7-8): 415-422.
- Cavedo, E., Dubois, B., Colliot, O., Lista, S., Croisile, B., Tisserand, G. L., Touchon, J., Bonafe, A., Ousset, P. J., Rouaud, O., Ricolfi, F., Vighetto, A., Pasquier, F., Galluzzi, S., Delmaire, C., Ceccaldi, M., Girard, N., Lehericy, S., Duveau, F., Chupin, M. and Hippocampus Study Group (2016). Reduced regional cortical thickness rate of change in donepezil-treated subjects with suspected prodromal Alzheimer's disease. J Clin Psychiatry 77(12): e1631-e1638.
- Cavedo, E., Grothe, M. J., Colliot, O., Lista, S., Chupin, M., Dormont, D., Houot, M., Lehéricy, S., Teipel, S., Dubois, B., Hampel, H. and Hippocampus Study Group (2017). Reduced basal forebrain atrophy progression in a randomized Donepezil trial in prodromal Alzheimer's disease. Sci Rep 7(1): 11706.
- Chen, X.-Q. and Mobley, W. C. (2019). Exploring the pathogenesis of Alzheimer disease in basal forebrain cholinergic neurons: Converging insights from alternative hypotheses. Front Neurosci 13: 446.
- Convery, R. S., Neason, M. R., Cash, D. M., Cardoso, M. J., Modat, M., Ourselin, S., Warren, J. D., Rohrer, J. D. and Bocchetta, M. (2020). Basal forebrain atrophy in frontotemporal dementia. NeuroImage Clin 26: 102210.
- Cykowski, M. D., Takei, H., Schulz, P. E., Appel, S. H. and Powell, S. Z. (2014). TDP-43 pathology in the basal forebrain and hypothalamus of patients with amyotrophic lateral sclerosis. Acta Neuropathol Commun 2: 171.
- Dubois, B., Chupin, M., Hampel, H., Lista, S., Cavedo, E., Croisile, B., Louis Tisserand, G., Touchon, J., Bonafe, A., Ousset, P. J., Ait Ameur, A., Rouaud, O., Ricolfi, F., Vighetto, A., Pasquier, F., Delmaire, C., Ceccaldi, M., Girard, N., Dufouil, C., Lehericy, S. and Hippocampus Study Group (2015). Donepezil decreases annual rate of hippocampal atrophy in suspected prodromal Alzheimer's disease. Alzheimers Dement 11(9): 1041-1049.
- Giacobini, E. and Pepeu, G. (2018). Sex and gender differences in the brain cholinergic system and in the response to therapy of Alzheimer disease with cholinesterase inhibitors. Curr Alzheimer Res 15(11): 1077-1084.
- Goubran, M., Leuze, C., Hsueh, B., Aswendt, M., Ye, L., Tian, Q., Cheng, M. Y., Crow, A., Steinberg, G. K., McNab, J. A., Deisseroth, K. and Zeineh, M. (2019). Multimodal image registration and connectivity analysis for integration of connectomic data from microscopy to MRI. Nat Commun 10(1): 5504.
- Grothe, M. J., Schuster, C., Bauer, F., Heinsen, H., Prudlo, J. and Teipel, S. J. (2014). Atrophy of the cholinergic basal forebrain in dementia with Lewy bodies and Alzheimer's disease dementia. J Neurol 261(10): 1939-1948.
- Hampel, H., Mesulam, M. M., Cuello, A. C., Farlow, M. R., Giacobini, E., Grossberg, G. T., Khachaturian, A. S., Vergallo, A., Cavedo, E., Snyder, P. J., and Khachaturian, Z. S. (2018). The cholinergic system in the pathophysiology and treatment of Alzheimer's disease. Brain 141(7): 1917-1933.
- Honig, L. S. (2018). Gene therapy in Alzheimer disease-It may be feasible, but will it be beneficial? JAMA Neurol 75(7): 791-793.
- Hynynen, K., McDannold, N., Vykhodtseva, N. and Jolesz, F. A. (2001). Noninvasive MR imaging guided focal opening of the blood-brain barrier in rabbits. Radiology 220(3): 640–646.
- Jones, R. M., Deng, L., Leung, K., McMahon, D., O'Reilly, M. A. and Hynynen, K. (2018). Three-dimensional transcranial microbubble imaging for guiding volumetric ultrasound-mediated blood-brain barrier opening. Theranostics 8(11): 2909-2926.
- Jordão, J. F., Thévenot, E., Markham-Coultes, K., Scarcelli, T., Weng, Y. Q., Xhima, K., O'Reilly, M., Huang, Y., McLaurin, J., Hynynen, K. and Aubert, I. (2013). Amyloid-β plaque reduction, endogenous antibody delivery and glial activation by brain-targeted, transcranial focused ultrasound. Exp Neurol 248: 16-29.
- Kelley, C. M., Powers, B. E., Velazquez, R., Ash, J. A., Ginsberg, S. D., Strupp, B. J., and Mufson, E. J. (2014). Sex differences in the cholinergic basal forebrain in the Ts65Dn mouse model of Down syndrome and Alzheimer's disease. Brain Pathol 24(1): 33-44.
- Kovacs, Z. I., Kim, S., Jikaria, N., Qureshi, F., Milo, B., Lewis, B. K., Bresler, M., Burks, S. R. and Frank, J. A. (2017). Disrupting the blood-brain barrier by focused ultrasound induces sterile inflammation. Proc Natl Acad Sci U S A 114: E75-E84.
- Leinenga, G. and Götz, J. (2015). Scanning ultrasound removes amyloid-β and restores memory in an Alzheimer's disease mouse model. Sci Trans Med 7(278): 278ra33.
- Marty, B., Larrat, B., Van Landeghem, M., Robic, C., Robert, P., Port, M., Le Bihan, D., Pernot, M., Tanter, M., Lethimonnier, F., and Mériaux, S. (2012). Dynamic study of blood-brain barrier closure after its disruption using ultrasound: a quantitative analysis. J Cereb Blood Flow Metab 32: 1948-1958.
- McMahon, D. and Hynynen, K. (2017). Acute inflammatory response following increased blood-brain barrier permeability induced by focused ultrasound is dependent on microbubble dose. Theranostics 7: 3989-4000.
- McMahon, D., Oakden, W. and Hynynen, K. (2020). Investigating the effects of dexamethasone on blood-brain barrier permeability and inflammatory response following focused ultrasound and microbubble exposure. Theranostics 10: 1604-1618.
- Menard, C., Pfau, M. L., Hodes, G. E., Kana, V., Wang, V. X., Bouchard, S., Takahashi, A., Flanigan, M. E., Aleyasin, H., LeClair, K. B., Janssen, W. G., Labonté, B., Parise, E. M., Lorsch, Z. S., Golden, S. A., Heshmati, M., Tamminga, C., Turecki, G., Campbell, M., Fayad, Z. A. and Russo, S. J. (2017). Social stress induces neurovascular pathology promoting depression. Nat Neurosci 20(12): 1752-1760.
- Meng, Y., Hynynen, K. and Lipsman, N. (2020). Applications of focused ultrasound in the brain: from thermoablation to drug delivery. Nat Rev Neurol 2021: 17(1): 7-22.
- O'Reilly, M. A. and Hynynen, K. (2012). Blood-brain barrier: real-time feedback-controlled focused ultrasound disruption by using an acoustic emissions-based controller. Radiology 263(1): 96-106.
- Pardridge, W. M. (2020). Blood-brain barrier and delivery of protein and gene therapeutics to brain. Front Aging Neurosci 11: 373.
- Park, J., Aryal, M., Vykhodtseva, N., Zhang, Y. Z. and McDannold, N. (2017). Evaluation of permeability, doxorubicin delivery, and drug retention in a rat brain tumor model after ultrasound-induced blood-tumor barrier disruption. J Control Release 250: 77-85.
- Paxinos, G. and Franklin, K. (2012). The mouse brain in stereotaxic coordinates, Ed 4. San Diego: Academic Press.
- Ray, N. J., Bradburn, S., Murgatroyd, C., Toseeb, U., Mir, P., Kountouriotis, G. K., Teipel, S. J. and Grothe, M. J. (2018). In vivo cholinergic basal forebrain atrophy predicts cognitive decline in de novo Parkinson's disease. Brain 141(1): 165-176.
- Sun, T., Zhang, Y., Power, C., Alexander, P. M., Sutton, J. T., Aryal, M., Vykhodtseva, N., Miller, E. L. and McDannold, N. J. (2017). Closed-loop control of targeted ultrasound drug delivery across the blood-brain/tumor barriers in a rat glioma model. Proc Natl Acad Sci U S A 114: E10281-E10290.
- Sweeney, M. D., Sagare, A. P. and Zlokovic, B. V. (2018). Blood-brain barrier breakdown in Alzheimer disease and other neurodegenerative disorders. Nat Rev Neurol 14(3): 133-150.
- Tuszynski, M. H., Thal, L., Pay, M., Salmon, D. P., U, H. S., Bakay, R., Patel, P., Blesch, A., Vahlsing, H. L., Ho, G., Tong, G., Potkin, S. G., Fallon, J., Hansen, L., Mufson, E. J., Kordower, J. H., Gall, C. and Conner, J. (2005). A phase 1 clinical trial of nerve growth factor gene therapy for Alzheimer disease. Nat Med 11(5): 551-555.
- Tuszynski, M. H., Yang, J. H., Barba, D., U, H.-S., Bakay, R. A. E., Pay, M. M., Masliah, E.,Conner, J. M., Kobalka, P., Roy, S. and Nagahara, A. H. (2015). Nerve growth factor gene therapy: Activation of neuronal responses in Alzheimer disease. JAMA Neurol 72(10): 1139-1147.
- Xhima, K., Markham-Coultes, K., Nedev, H., Heinen, S., Saragovi, H. U., Hynynen, K., and Aubert, I. (2020). Focused ultrasound delivery of a selective TrkA agonist rescues cholinergic function in a mouse model of Alzheimer's disease. Sci Adv 6(4): eaax6646.
- Xhima, K., and Aubert, I. (2021). The therapeutic potential of nerve growth factor combined with blood-brain barrier modulation by focused ultrasound for neurodegenerative disorders. Neural Regen Res 16(9): 1783-1785.
- Yang, A. C., Stevens, M. Y., Chen, M. B., Lee, D. P., Stähli, D., Gate, D., Contrepois, K., Chen, W., Iram, T., Zhang, L., Vest, R. T., Chaney, A., Lehallier, B., Olsson, N., du Bois, H., Hsieh, R., Cropper, H. C., Berdnik, D., Li, L., Wang, E. Y. and Wyss-Coray, T. (2020). Physiological blood-brain transport is impaired with age by a shift in transcytosis. Nature 583(7816): 425-430.
- Yang, F. Y., Wang, H. E., Lin, G. L., Lin, H. H. and Wong, T. T. (2012). Evaluation of the increase in permeability of the blood-brain barrier during tumor progression after pulsed focused ultrasound. Int J Nanomedicine 7: 723-730.
Article Information
Publication history
Accepted: Mar 5, 2021
Published: Jun 20, 2021
Copyright
© 2021 The Authors; exclusive licensee Bio-protocol LLC.
How to cite
Readers should cite both the Bio-protocol article and the original research article where this protocol was used:
- Xhima, K., McMahon, D., Ntiri, E., Goubran, M., Hynynen, K. and Aubert, I. (2021). Intravenous and Non-invasive Drug Delivery to the Mouse Basal Forebrain Using MRI-guided Focused Ultrasound. Bio-protocol 11(12): e4056. DOI: 10.21769/BioProtoc.4056.
- Xhima, K., Markham-Coultes, K., Nedev, H., Heinen, S., Saragovi, H. U., Hynynen, K., and Aubert, I. (2020). Focused ultrasound delivery of a selective TrkA agonist rescues cholinergic function in a mouse model of Alzheimer's disease. Sci Adv 6(4): eaax6646.
Category
Neuroscience > Nervous system disorders > Blood brain barrier
Cell Biology > Tissue analysis > Physiology
Cancer Biology > General technique
Do you have any questions about this protocol?
Post your question to gather feedback from the community. We will also invite the authors of this article to respond.
![]() Tips for asking effective questions
Tips for asking effective questions
+ Description
Write a detailed description. Include all information that will help others answer your question including experimental processes, conditions, and relevant images.