
- Submit a Protocol
- Receive Our Alerts
- EN

- Protocols

- Articles and Issues
- For Authors
- About
- Become a Reviewer

Monitoring Changes in the Oxidizing Milieu in the Endoplasmic Reticulum of Mammalian Cells Using HyPerER
Published: Vol 11, Iss 13, Jul 5, 2021 DOI: 10.21769/BioProtoc.4076 Views: 2606
Reviewed by: Begoña DiazAnonymous reviewer(s)
Original research article
The authors used this protocol in:

Feb 2020

Protocol Collections
Comprehensive collections of detailed, peer-reviewed protocols focusing on specific topics


Abstract
The production of reactive oxygen species (ROS) and endoplasmic reticulum (ER) stress are tightly linked. The generation of ROS can be both the cause and a consequence of ER stress pathways, and an increasing number of human diseases are characterized by tissue atrophy in response to ER stress and oxidative injury. For the assessment of modulators of ER luminal ROS generation and for mechanistic studies, methods to monitor changes in ER reduction-oxidation (redox) states in a time-resolved and organelle-specific manner are needed. This has been greatly facilitated by the development of genetically encoded fluorescent probes, which can be targeted to different subcellular locations by specific amino acid extensions. One of these probes is the yellow fluorescent protein-based redox biosensor, HyPer. Here, we provide a protocol for the time-resolved monitoring of the oxidizing milieu in the ER of adherent mammalian cells using the ratiometric sensor, HyPerER, which is specifically targeted to the ER lumen.
Keywords: Endoplasmic reticulumBackground
The endoplasmic reticulum (ER) plays key roles in essential functions including protein folding and maturation in the secretory pathway, lipid metabolism, hormone synthesis, and detoxification of reactive metabolites (Bock and Kohle, 2009; Chen and Cubillos-Ruiz, 2020; Erdbrugger and Frohlich, 2020; Morishita and Arvan, 2020). Research on the ER has attracted increasing interest in recent years, mainly due to the discovery of the unfolded protein response (UPR) signaling pathway, which is triggered by diverse forms of protein folding stress in the ER. The physical contact sites of the ER with other cell organelles and their involvement in cellular communication networks establish the ER as a multifaceted regulator of cell signaling. The relationship between ER stress and oxidative injury has been extensively investigated; however, the origin of ER stress-induced ROS production remains unclear (Appenzeller-Herzog, 2011), and tools to detect xenobiotics that enhance ROS in the ER are limited.
To understand the mechanisms of oxidative insults, specific tools are required to quantitate and describe ER redox conditions. Genetically encoded sensors to quantitate the oxidative status of the many redox couples present in the ER have proven useful. Changes in the amount of H2O2 in the cytoplasm can be monitored using the fluorescent probe, HyPer (Belousov et al., 2006). The HyPer sensor was constructed by inserting a circularly permutated yellow fluorescent protein (YFP) into the regulatory domain of the bacterial H2O2-sensing protein, OxyR. Importantly, HyPer was shown to selectively detect H2O2 over superoxide, peroxinitrite, nitric oxide, and oxidized glutathione in the cytosol. Upon oxidation of the cysteine corresponding to Cys199 of OxyR, the sensor protein HyPer undergoes a conformational change. HyPer has two excitation peaks at 420 nm and 500 nm, and one emission peak at 516 nm. Upon transition from the reduced to the oxidized state, the peak at 420 nm decreases and the peak at 500 nm increases, thus allowing ratiometric measurement of H2O2.
Here, we describe a detailed protocol for the real-time imaging and monitoring of the oxidizing milieu in the ER using the HyPerER sensor, which is targeted specifically to the ER lumen (Enyedi et al., 2010; Malinouski et al., 2011) by the addition of an N-terminal ER-targeting sequence and a C-terminal ER-retrieval signal (KDEL). It must be noted that the ER-targeted HyPerER, unlike cytosolic HyPer, is not specific for H2O2 but rather reflects the oxidative milieu within the ER (Mehmeti et al., 2012). The approach can be used in different cellular systems with basic understanding of live cell imaging and fluorescence microscopy (an example is shown in Figure 1), whereby data analysis is dependent on the available software. A limitation of the original HyPer sensors is their sensitivity to pH changes. To overcome this limitation, a very recent study introduced a new generation HyPer probe, HyPer7, which is pH-resistant yet remains ultra-sensitive to changes in H2O2 (Pak et al., 2020). Monitoring H2O2 specifically in the ER remains challenging, and most of the probes available to date have not been used in this very special cellular compartment.
Materials and Reagents
Materials
Pipette tips
Glass-bottomed dishes (such as MatTek, catalog number: P35G-1.5-20-C; IBIDI µ-Dish 35 mm, high Glass Bottom, catalog number: 81158; Sarstedt lumox dish 35, catalog number: 94.6077.331; Nunc Glass Bottom Dishes, catalog number: 150680)
1.5-ml tubes
50-ml conical centrifugation tubes
Reagents
HeLa cells (ATCC, catalog number: CCL-2)
Dulbecco’s Modified Eagle’s Medium (DMEM) – high glucose (Sigma-Aldrich, catalog number: D5796)
Fetal bovine serum, FBS (South America) (Biowest, catalog number: S1810)
Penicillin/streptomycin 100× (BioConcept-Amimed, catalog number: 4-01F00-H)
Trypsin-EDTA solution 10× (Sigma-Aldrich, catalog number: T4174-100ML)
OptiMEM-I (Gibco, catalog number: 51985026)
FuGENE HD (Promega, catalog number: E2311)
HEPES (PanReac AppliChem, catalog number: A1069)
CaCl2·2H2O (Merck, catalog number: 1.02382.0500)
KCl (Merck, catalog number: 1.04936.1000)
MgCl2·6H2O (Fluka, catalog number: 63064)
NaCl (PanReac AppliChem, catalog number: A2942)
DTT (PanReac AppliChem, catalog number: A1101)
H2O2 solution (Sigma-Aldrich, catalog number: 95321)
pCMV/myc/ER/GFP HyPerER (Enyedi et al., 2010) (Kind gift from Dr. Miklos Geiszt, Semmelweis University, Budapest, Hungary)
Stimulants and inhibitors (experiment-dependent), e.g., thapsigargin (EMD Millipore, catalog number: 586005)
HEPES Imaging Buffer (1 L) (see Recipes)
Equipment
Pipettes
Casy cell counter (Omni Life Science) or hemocytometer
Heat block for 50-ml conical tubes
Inverted microscope; we use an Olympus Fluoview3000 laser scanning microscope
60× Objective UPLSAPO60XS2 Universal Plan Super Apochromat silicone immersion objective N.A. 1.3 (N5203000)
For excitation, we use an Olympus FVL-LAS405-LX50 Laser 405 nm and FVL-LAS488-LS20 Laser 488 nm (somewhat below the excitation peaks at 420 nm and 500 nm, respectively)
Note: Monitoring of HyPer probes does not require confocality! A fluorescence microscope with suitable filter sets for excitation and emission is sufficient.
Excitation maximum of HyPer: 500 nm
Emission maximum of HyPer: 516 nm
Climate control unit; we use the Olympus CellVivo incubator system for IX83 (E0439957)
Note: Live cell experiments should be performed under optimal environmental conditions; the minimal requirement is a temperature controller to maintain the optimal temperature of 37°C; for long-term experiments, e.g., longer than 30 min, an additional CO2 supply will be needed.
Software
FV300 (Olympus)
Excel (Microsoft)
Procedure
Cell culture and seeding
Cells should be cultured in their corresponding growth medium until they reach a confluence of around 70%.
Wash the cells with 10 ml 1× PBS.
Detach the cells with 2 ml pre-warmed (37°C) 1× trypsin (0.5 g/L) at room temperature for 4 min and resuspend in 8 ml complete growth medium.
Determine the number of cells in the suspension using a Casy cell counter or hemocytometer.
Seed 30,000 cells in 400 µl complete growth medium to the center well of a Matek glass-bottomed dish.
Cell density may depend on the cell type and transfection method used.
Place the dish in a humidified cell culture incubator (37°C, 5% CO2) and incubate overnight.
Transfection
Mix 25 µl Opti-MEM medium with 0.5 µg HyPerER plasmid and 1.5 µl Fugene® HD solution (according to the manufacturer’s protocol).
Incubate the mixture for 15 min at room temperature and add dropwise to the cells.
Add 2.6 ml complete growth medium approximately 6 h after transfection.
Incubate the cells at 37°C for 24-48 h.
Note: The optimal transfection conditions, e.g., cell density, DNA amount, and DNA:Fugene® HD ratio, will require optimization depending on the cell line of choice.
Imaging
Imaging is performed on an Olympus Fluoview 3000 laser-scanning microscope with a temperature- and CO2-controlling unit. Samples are excited sequentially using the 405 nm and 488 nm lasers. Emission is recorded in a window from 500 to 600 nm.
Note: There is only one emission window for both excitation wavelengths!
Take out the cell culture dish from the incubator and remove culture medium with a pipette.
Carefully wash the dish twice with 1 ml pre-warmed HEPES Imaging Buffer.
Add 1 ml HEPES Imaging Buffer and place the dish on the microscope stage.
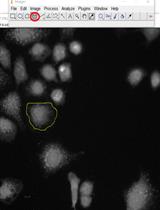
Search for a field of view that contains several healthy-looking cells with sufficient YFP fluorescence signal.
Optimize the voltage of the photomultiplier tube to obtain good image quality (signal-to-noise) for both channels.
Measure the baseline oxidative status of HyPerER in the cells every 20 s for at least 5 min, then carefully add stimulating substances, such as thapsigargin (final concentration 1 µM), at double working concentration in 1 ml HEPES Imaging Buffer with a pipette and record until the signal stabilizes (or according to the stimulation protocol). Make sure to complete the addition within the 20-s time window between two image acquisitions. The speed of the acquisition and the total imaging time should be optimized to achieve proper temporal resolution but also to avoid photobleaching.
Conclude each measurement by the addition of a single dose of saturating H2O2 (100 µM final concentration in 1 ml HEPES Imaging Buffer) as a positive control, carefully applied with a pipette. An example in HeLa cells is shown in Figure 1.
Data analysis
Analysis using the FV3000 software:
Define the regions of interest (ROI) in your sample and select a suitable area to place a background ROI.
Measure the raw emission intensity within these ROIs.
Export the raw intensity values from the software as .csv files.
Open the .csv files in Microsoft Excel. You will obtain two emission intensity values, determined at 516 nm, for each time point measured for every ROI, one for excitation at 488 nm and one for excitation at 405 nm. Perform the following calculation:
Subtract the intensity values of the background ROI obtained at 405-nm excitation from the target ROI measured at 405 nm.
Subtract the intensity values of the background ROI obtained at 488-nm excitation from the target ROI measured at 488 nm.
Calculate the fluorescence ratio using the following formula (for an example, see Figure 1):

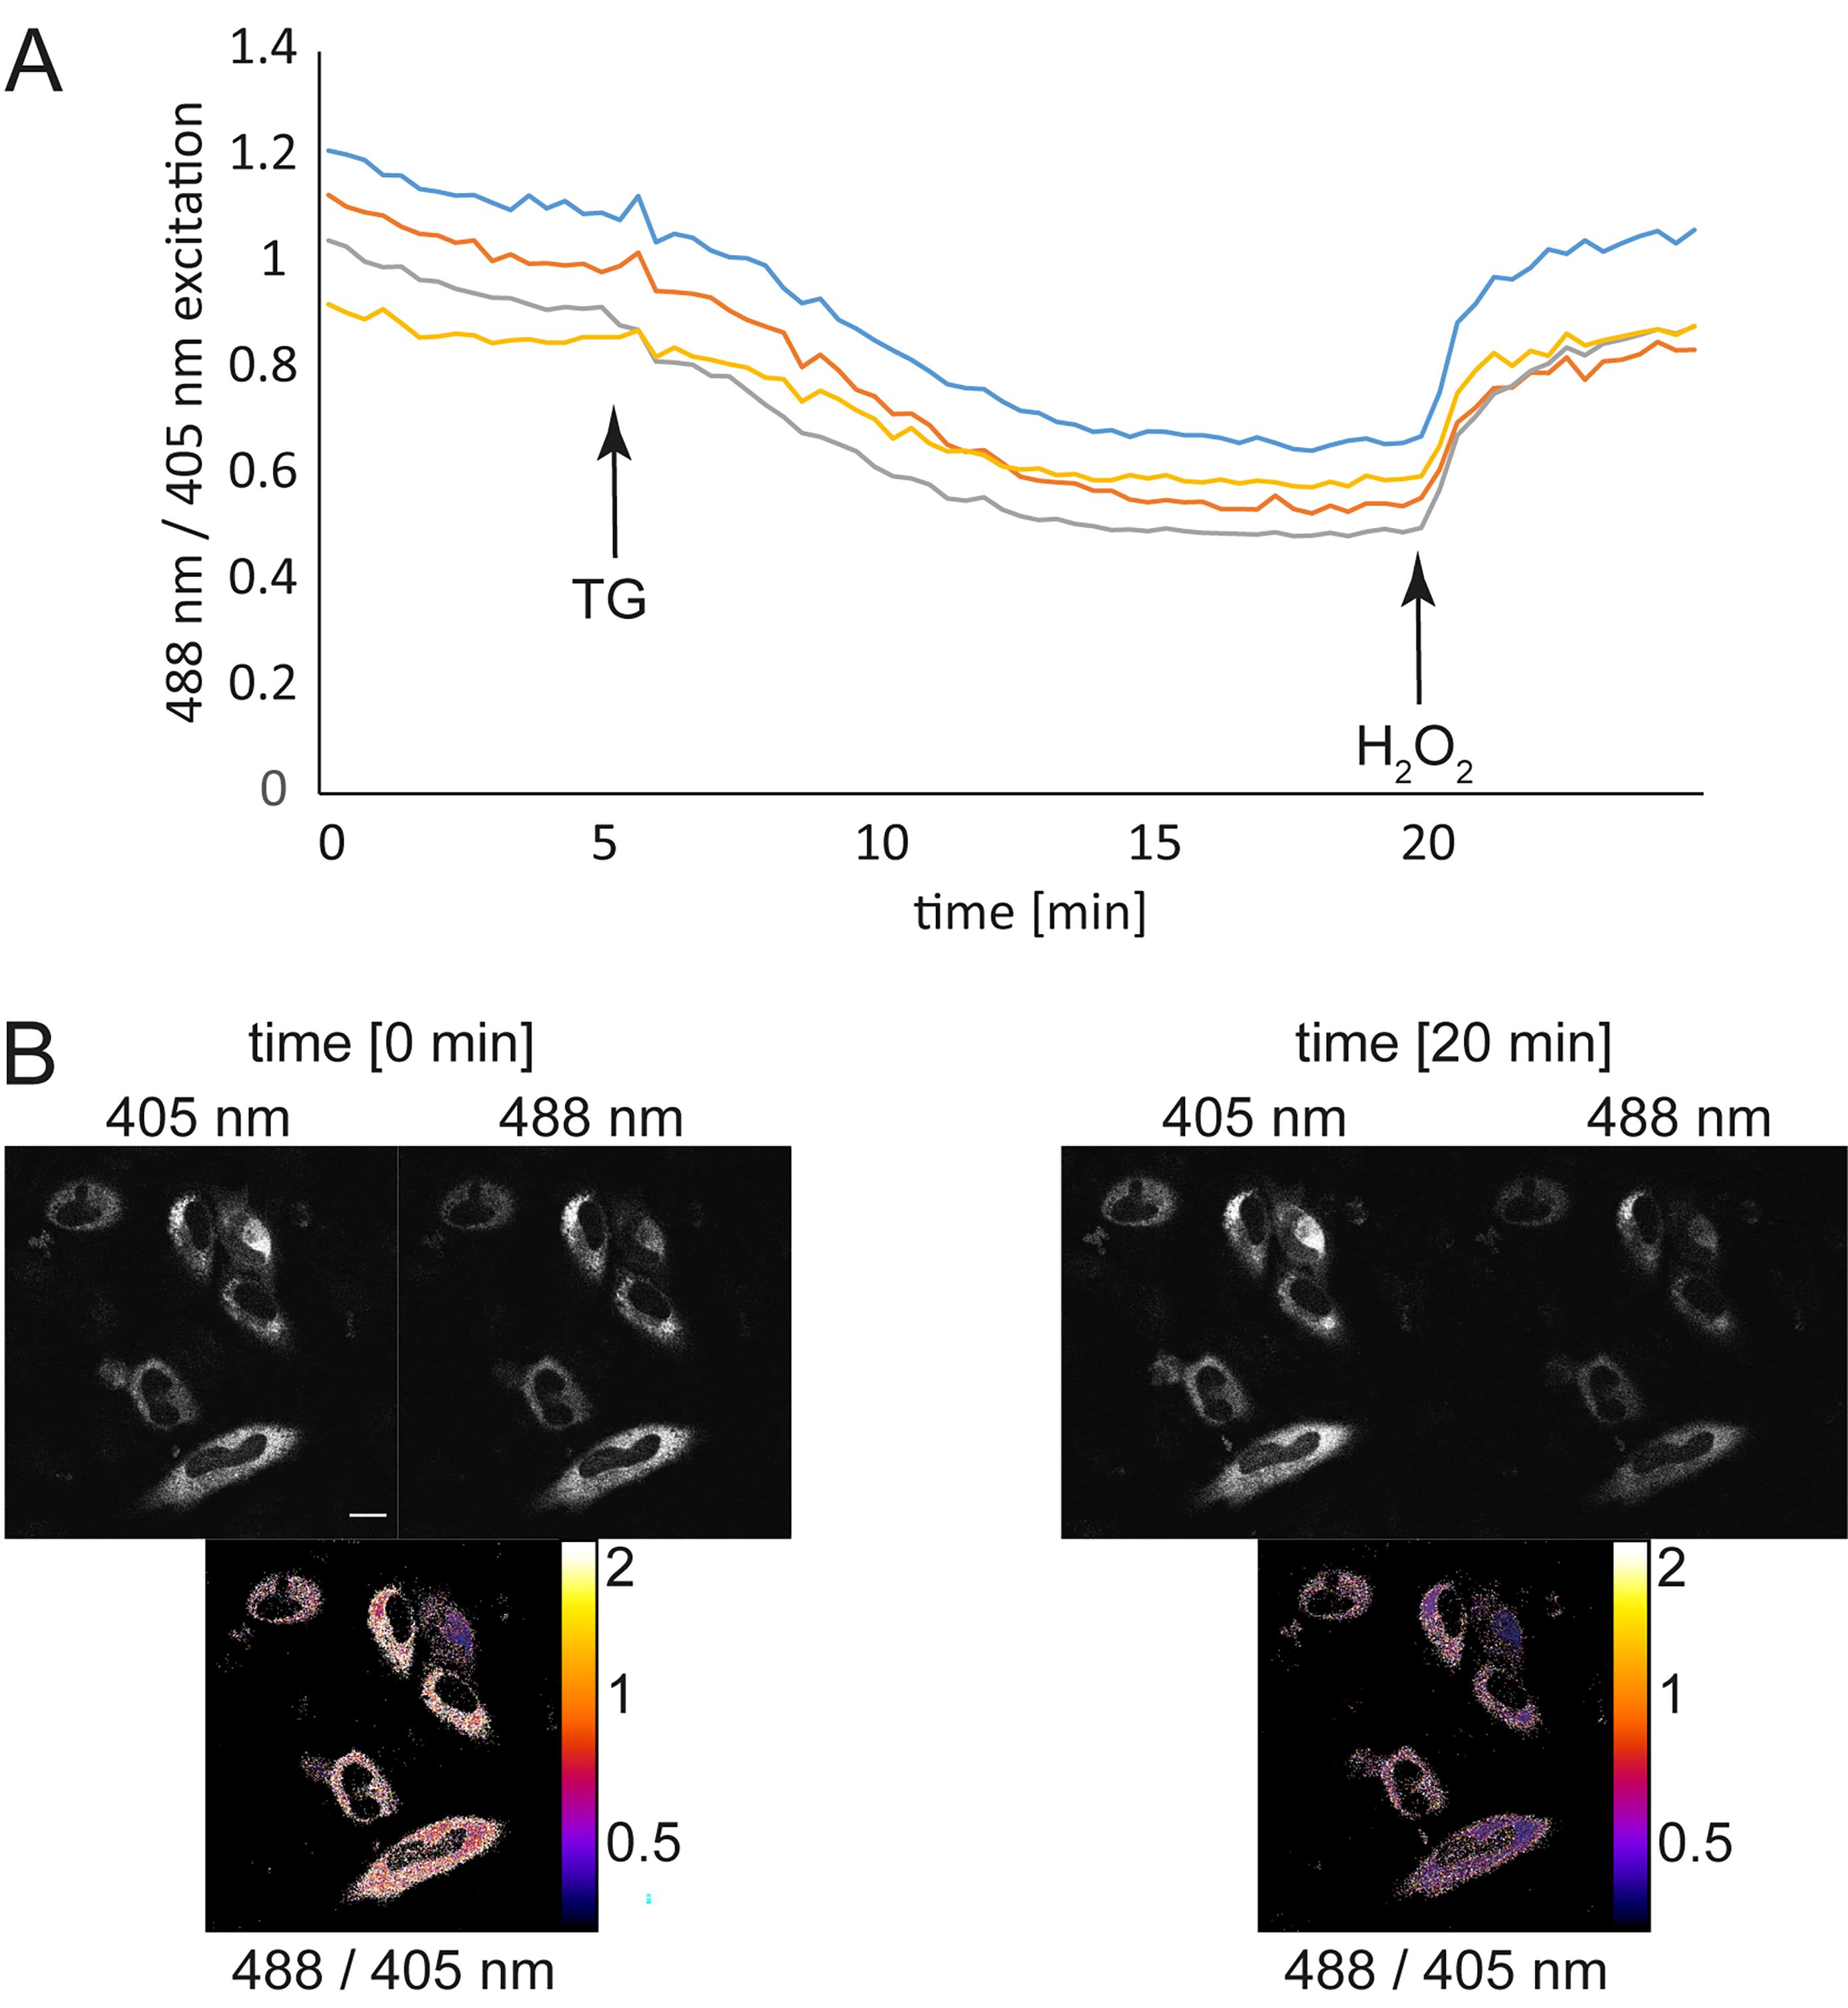
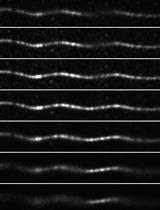
Figure 1. Real-time monitoring of ER redox changes. HeLa cells were transfected with the HyPerER sensor using Fugene® HD. At 48 h post-transfection, the cells were prepared for imaging. Fluorescence ratio changes were monitored over time. A. Each trace corresponds to the data recorded from one cell. The cells were treated with 1 µM thapsigargin (TG), which reduces the ER environment by facilitating the influx of reduced glutathione (Lizak et al., 2020), followed by the application of 100 µM H2O2, which leads to re-oxidation. B. Exemplary fluorescence pictures in the 405-nm or 488-nm channel and the corresponding ratiometric images. Scale bar = 10 µm. The pseudocolored images represent the ratio R, obtained by dividing the values measured at 488-nm excitation and 516-nm emission after background subtraction by the values measured at 405-nm excitation and 516-nm emission. A darker color indicates a lower ratio and hence less H2O2; a lighter color represents a higher ratio and hence more H2O2.
Recipes
HEPES Imaging Buffer (1 L)
1 M HEPES solution (sterile-filtered) 20 ml; final concentration 20 mM
1 M KCl solution (sterile-filtered) 5 ml; final concentration 5 mM
1 M CaCl2 solution (sterile-filtered) 1.8 ml; final concentration 1.8 mM
1 M MgCl2 solution (sterile-filtered) 1 ml; final concentration 1 mM
1 M NaCl solution (sterile-filtered) 130 ml; final concentration 130 mM
Fill to 1 L with ddH2O and adjust pH to 7.4
Acknowledgments
This protocol was adapted from Lizak et al. (2020). Funding by the Swiss National Science Foundation (SNSF, 31003A-179400) and the University of Basel is gratefully acknowledged.
Competing interests
The authors declare that this research was conducted in the absence of any commercial or financial relationships that could be construed as a potential conflict of interest.
References
- Appenzeller-Herzog, C. (2011). Glutathione- and non-glutathione-based oxidant control in the endoplasmic reticulum. J Cell Sci 124(Pt 6): 847-855.
- Belousov, V. V., Fradkov, A. F., Lukyanov, K. A., Staroverov, D. B., Shakhbazov, K. S., Terskikh, A. V. and Lukyanov, S. (2006). Genetically encoded fluorescent indicator for intracellular hydrogen peroxide. Nat Methods 3(4): 281-286.
- Bock, K. W. and Kohle, C. (2009). Topological aspects of oligomeric UDP-glucuronosyltransferases in endoplasmic reticulum membranes: advances and open questions. Biochem Pharmacol 77(9): 1458-1465.
- Chen, X. and Cubillos-Ruiz, J. R. (2021). Endoplasmic reticulum stress signals in the tumour and its microenvironment. Nat Rev Cancer 21(2): 71-88.
- Enyedi, B., Varnai, P. and Geiszt, M. (2010). Redox state of the endoplasmic reticulum is controlled by Ero1L-alpha and intraluminal calcium. Antioxid Redox Signal 13(6): 721-729.
- Erdbrugger, P. and Frohlich, F. (2020). The role of very long chain fatty acids in yeast physiology and human diseases. Biol Chem 402(1): 25-38.
- Lizak, B., Birk, J., Zana, M., Kosztyi, G., Kratschmar, D. V., Odermatt, A., Zimmermann, R., Geiszt, M., Appenzeller-Herzog, C. and Banhegyi, G. (2020). Ca2+ mobilization-dependent reduction of the endoplasmic reticulum lumen is due to influx of cytosolic glutathione. BMC Biol 18(1): 19.
- Malinouski, M., Zhou, Y., Belousov, V. V., Hatfield, D. L. and Gladyshev, V. N. (2011). Hydrogen peroxide probes directed to different cellular compartments. PLoS One 6(1): e14564.
- Mehmeti, I., Lortz, S. and Lenzen, S. (2012). The H2O2-sensitive HyPer protein targeted to the endoplasmic reticulum as a mirror of the oxidizing thiol-disulfide milieu. Free Radic Biol Med 53(7): 1451-1458.
- Morishita, Y. and Arvan, P. (2020). Lessons from animal models of endocrine disorders caused by defects of protein folding in the secretory pathway. Mol Cell Endocrinol 499: 110613.
- Pak, V. V., Ezerina, D., Lyublinskaya, O. G., Pedre, B., Tyurin-Kuzmin, P. A., Mishina, N. M., Thauvin, M., Young, D., Wahni, K., Martinez Gache, S. A., Demidovich, A. D., Ermakova, Y. G., Maslova, Y. D., Shokhina, A. G., Eroglu, E., Bilan, D. S., Bogeski, I., Michel, T., Vriz, S., Messens, J. and Belousov, V. V. (2020). Ultrasensitive Genetically Encoded Indicator for Hydrogen Peroxide Identifies Roles for the Oxidant in Cell Migration and Mitochondrial Function. Cell Metab 31(3): 642-653 e646.
Article Information
Publication history
Accepted: Apr 13, 2021
Published: Jul 5, 2021
Copyright
© 2021 The Authors; exclusive licensee Bio-protocol LLC.
How to cite
Birk, J., Lizak, B., Appenzeller-Herzog, C. and Odermatt, A. (2021). Monitoring Changes in the Oxidizing Milieu in the Endoplasmic Reticulum of Mammalian Cells Using HyPerER. Bio-protocol 11(13): e4076. DOI: 10.21769/BioProtoc.4076.
Category
Cancer Biology > Cellular energetics
Biochemistry > Protein > Fluorescence
Do you have any questions about this protocol?
Post your question to gather feedback from the community. We will also invite the authors of this article to respond.
![]() Tips for asking effective questions
Tips for asking effective questions
+ Description
Write a detailed description. Include all information that will help others answer your question including experimental processes, conditions, and relevant images.