
- Submit a Protocol
- Receive Our Alerts
- EN

- Protocols

- Articles and Issues
- For Authors
- About
- Become a Reviewer

A Cell-based Screening Method Using an Intracellular Antibody for Discovering Small Molecules Targeting Hard-to-drug Proteins
Published: Vol 12, Iss 4, Feb 20, 2022 DOI: 10.21769/BioProtoc.4324 Views: 2615
Reviewed by: Alessandro DidonnaYoshihiro AdachiAnonymous reviewer(s)
Original research article
The authors used this protocol in:

Apr 2021

Protocol Collections
Comprehensive collections of detailed, peer-reviewed protocols focusing on specific topics


Abstract
Targeting hard-to-drug proteins, such as proteins functioning by protein-protein interactions (PPIs) with small molecules, is difficult because of the lack of well-defined pockets. Fragment or computational-based methods are usually employed for the discovery of such compounds, but no generic method is available to quickly identify small molecules interfering with PPIs. Here, we provide a protocol describing a generic method to discover small molecules inhibiting the interaction between an intracellular antibody and its target, in particular for proteins that are hard to make in recombinant form. This protocol reports a versatile and generic method that can be applied to any target/intracellular antibody. Because it is a cell-based assay, it identifies chemical matters that are already displaying advantageous cell permeability properties.
Graphic abstract:
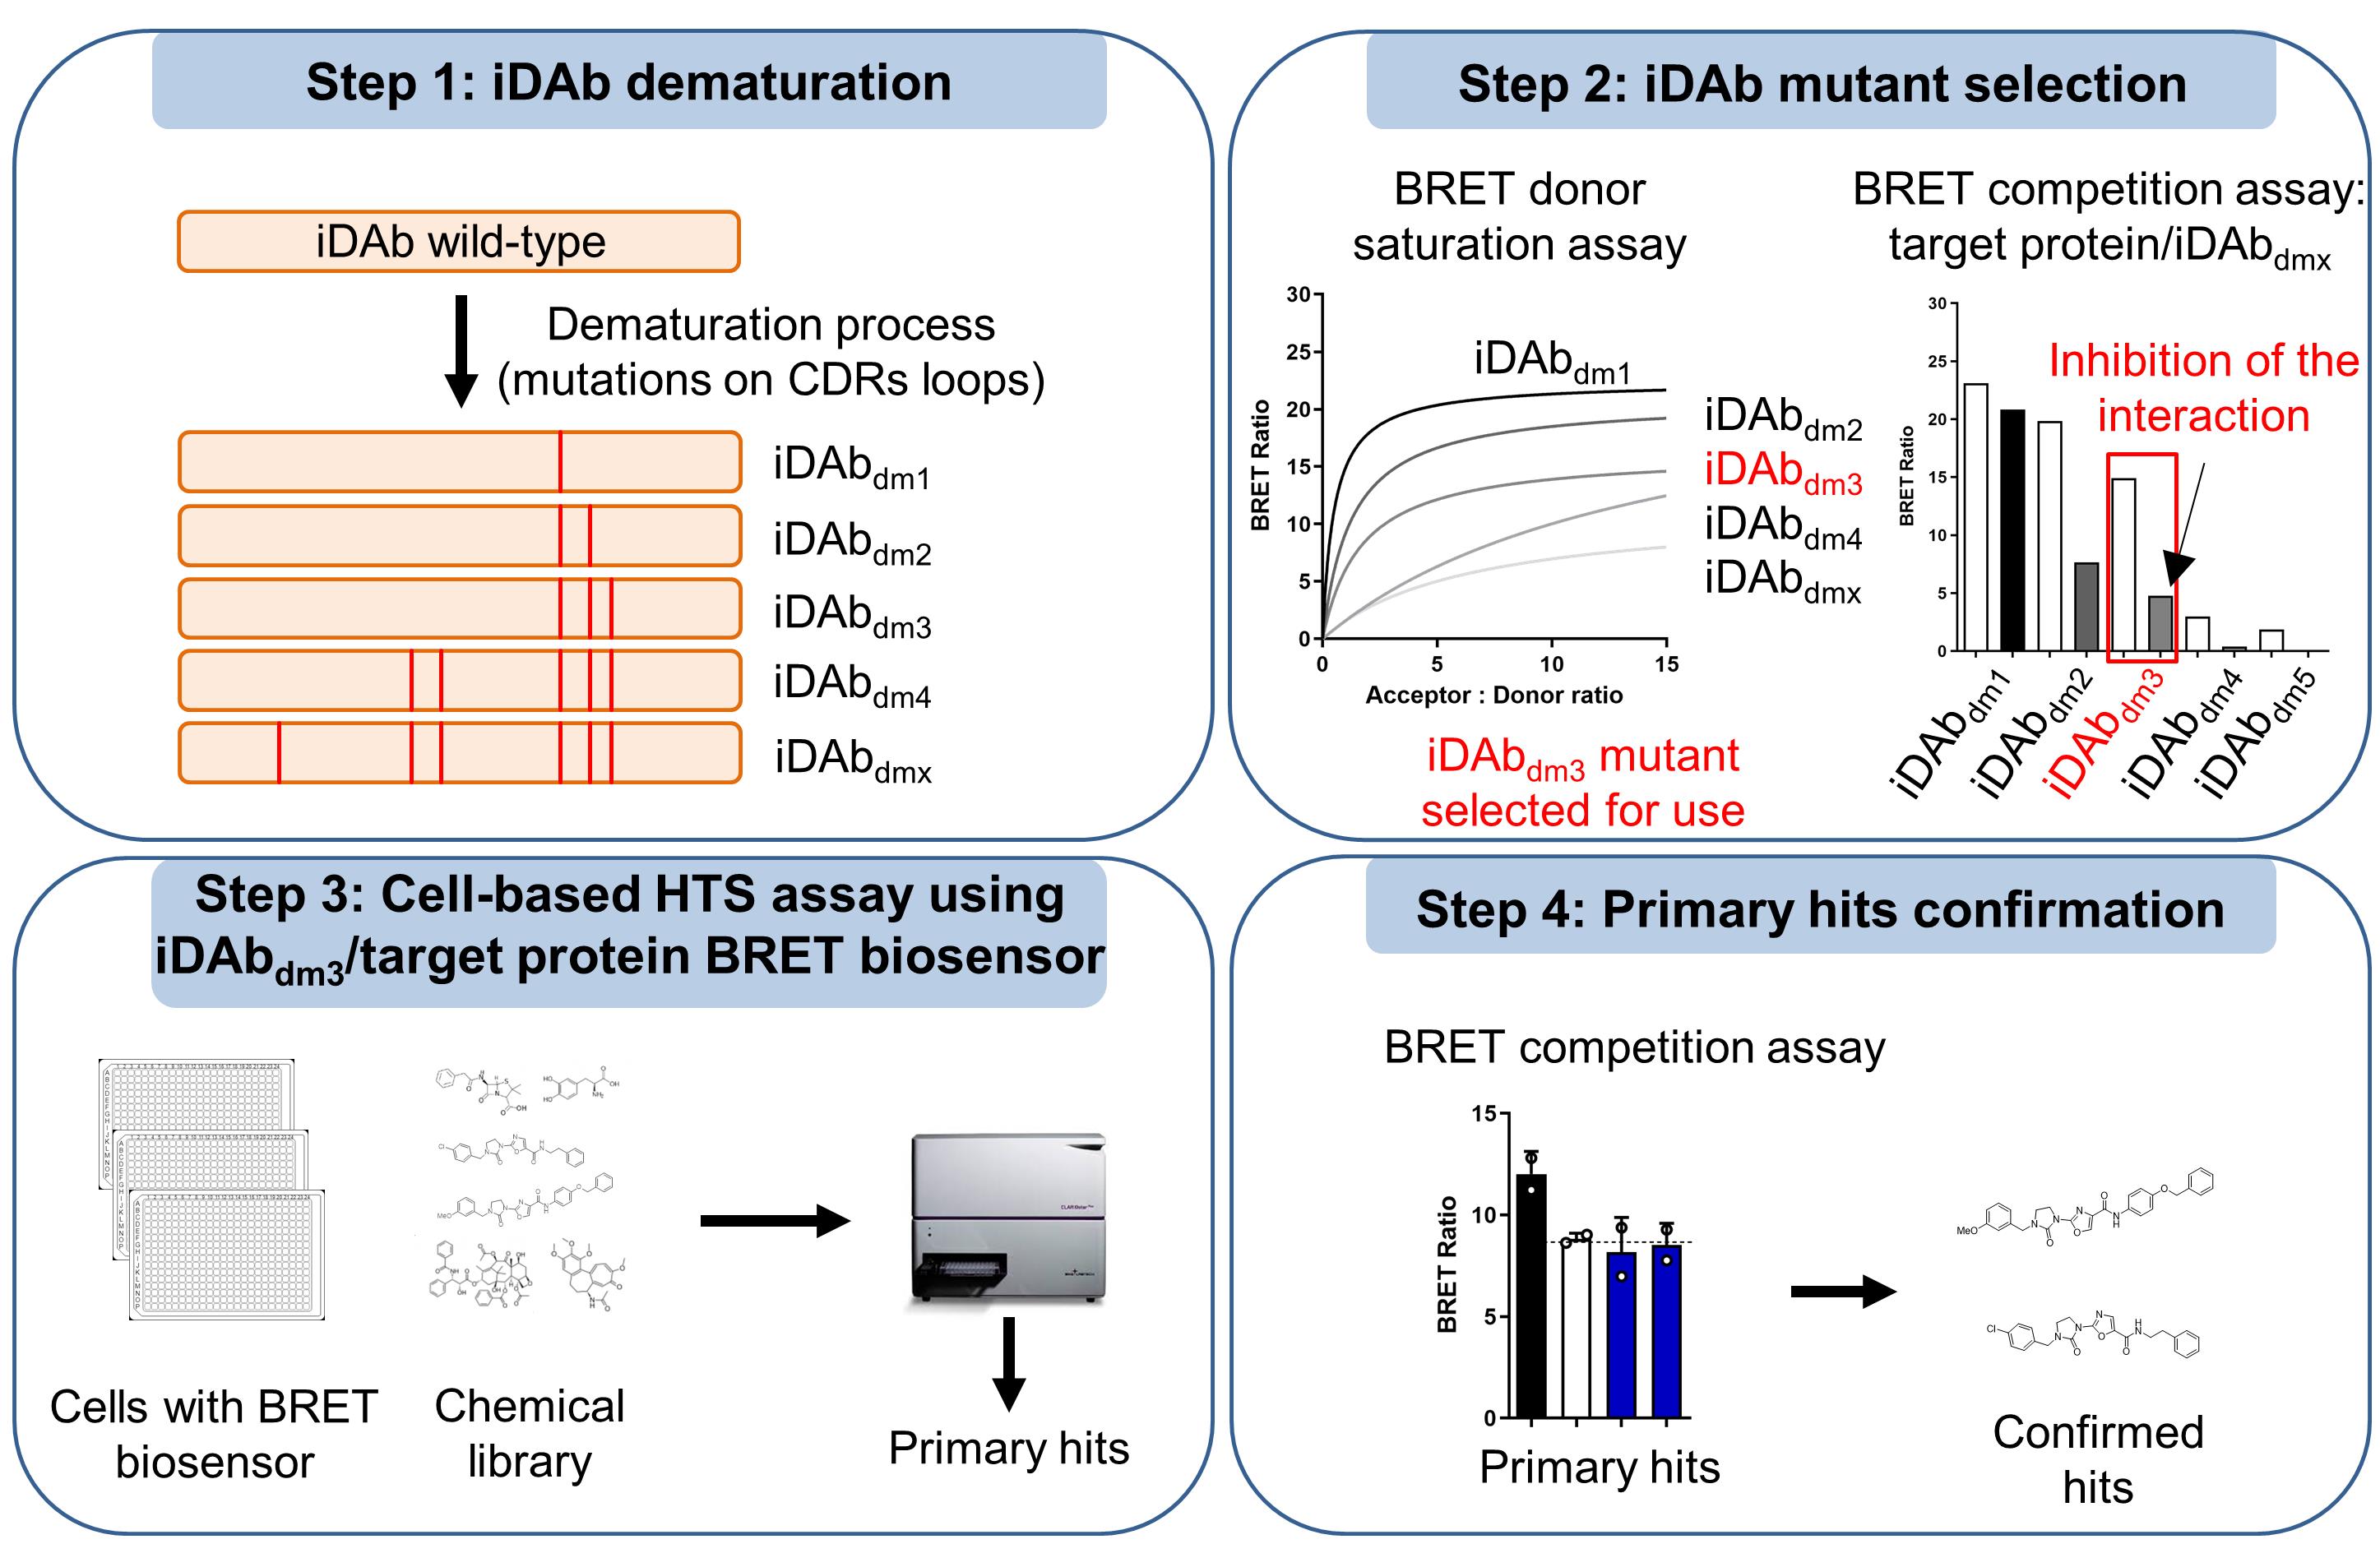
Cell-based intracellular antibody-guided small molecule screening.
Background
Targeting protein-protein interactions (PPIs) with small molecules is a challenging task, due to their relatively large interaction interface and the lack of well-defined pockets. Hence, implementing generic methods to discover such compounds would be highly valuable. Interestingly, PPIs can be inhibited by intracellular macromolecules, such as intracellular single domain antibodies (hereafter named iDAbs) (Tanaka et al., 2007 and 2011), or antibody mimetics (Guillard et al., 2017; Bery et al., 2019b). The advantages of such reagents are their high specificity for their target and their ability to discriminate isoforms of protein families (Bery et al., 2019a and 2019b), which can enable the identification of novel targetable regions. Therefore, we developed an intracellular antibody-guided method to screen small molecules named antibody-derived compound (Abd). We first used this method in a competitive surface plasmon resonance (cSPR) set-up to identify anti-RAS small molecules that bind at the combining site of an anti-RAS iDAb (Quevedo et al., 2018). However, favourable binding properties of the intracellular antibody with its target (very high affinity, high Kon, and low Koff) and recombinant protein targets that are easily expressed are required for this biochemical Abd assay. Furthermore, the selected compounds should have advantageous properties in cellular uptake with this assay. Therefore, new versatile methods would be important to rapidly discover small molecules against difficult drug targets.
Accordingly, we implemented an Abd cell-based screening method. We developed bioluminescence resonance energy transfer 2 (BRET2)-based LIM domain only 2 (LMO2) biosensors, based on the strategy of RAS biosensors (Bery et al., 2018), to monitor the interaction between the chromosomal translocation protein LMO2 and its iDAb. This technique enabled the selection of compounds that interfere with this interaction in cells (Bery et al., 2021). The cell-based Abd assay is a versatile method, as the measured in vitro affinity of the iDAbs for their target is not a limitation. High-affinity iDAbs could be dematured to reduce their binding for use in the cell-based assay (Tanaka et al., 2021). In addition, this method is not limited by proteins that are difficult to express and/or to purify in recombinant form. Finally, the intrinsic advantage of cell-based assays is that the compounds already have the characteristic of cell entry, a highly relevant property for the use of small molecules as drugs.
This protocol could be implemented in any intracellular antibody (or antibody mimetic) targeting challenging proteins, such as transcription factors or chromosomal translocation proteins.
Materials and Reagents
6-well plates (Corning, catalog number: 3516)
Corning HYPERFlask M cell culture vessels (Corning, catalog number: 10030)
Corning® 250 mL PP centrifuge tubes (Corning, catalog number: 430776)
White 96-well plates, clear bottom (PerkinElmer, catalog number: 6005181)
White 384-well plates, clear bottom (PerkinElmer, catalog number: 6007480)
Aluminum foil
White adhesive bottom seal for 96 and 384-well plates (PerkinElmer, catalog number: 6005199)
HEK293T cells (ATCC# CRL-3216, RRID:CVCL_0063)
Chemically competent DH5α cells (New England Biolabs (NEB), catalog number: C2987H)
Penicillin/streptomycin (PS) (Thermo Fisher, catalog number: 10378016)
Trypsin (Thermo Fisher, catalog number: 25300054)
DMEM (Thermo Fisher, catalog number: 10566016)
OptiMEM medium (Thermo Fisher, catalog number: 31985070)
Lipofectamine 2000 (Thermo Fisher, catalog number: 11668019)
Fetal bovine serum (FBS; Sigma, catalog number: F2442)
Phosphate-buffered saline (PBS; Thermo Fisher, catalog number: 10010023)
RLuc8 construct (see Table 1, sequence freely available in Bery et al., 2018)
GFP2 constructs (see Table 1, sequences freely available in Bery et al., 2021)
LMO2 competitors’ plasmids (see Table 1, sequences freely available in Bery et al., 2018)
OptiMEM no red phenol (Thermo Fisher, catalog number: 11058021)
Coelenterazine 400a (Cayman Chemicals, catalog number: 16157). Store at -20°C if not reconstituted.
100% ethanol (Sigma, catalog number: 32221-M54)
Dimethyl Sulfoxide (DMSO; Sigma, catalog number: D2650)
QIAquick Gel Extraction Kit (QIAGEN, catalog number: 28704)
Agarose (Sigma, catalog number: A9539-500G)
Restriction enzymes: NotI-HF, XbaI, PspOMI (NEB, catalog numbers: R3189S, R0145S and R0653S respectively)
Vent DNA polymerase (NEB, catalog number: M0254S)
T4 DNA Ligase (NEB, catalog number: M0202S)
Ampicillin (Sigma, catalog number: A0166)
pEF-myc-cyto, empty plasmid (Invitrogen, catalog number: V89120)
In-house library of 10,720 compounds (comprising 6991 compounds from BioFocus and 3729 from ChemBridge). Stored at -20°C
BRET medium (see Recipes)
BRET substrate (see Recipes)
Table 1. List of donor and acceptors constructs available for BRET2-based LMO2 biosensors
RLuc8 Donor construct GFP2 Acceptors constructs Competitors constructs LMO2 iDAb LMO2 WT iDAb LMO2-myc (positive control, Bery et al., 2018) iDAb LMO2 S55A/T107A
(iDAb LMO2dm)iDAb RAS-myc (negative control, Bery et al., 2018) iDAb LMO2 S28G/H31G/S55A/T107A
(iDAb LMO2dm1)iDAb LMO2 S55A/E102A/T107A
(iDAb LMO2dm2)iDAb LMO2 S28G/H31G/S55A/E102A/T107A
(iDAb LMO2dm3)iDAb LMO2 S28G/H31G/S55A/S103A/T107A
(iDAb LMO2dm4)iDAb LMO2 S55A/E102A/S103A/T107A
(iDAb LMO2dm5)iDAb LMO2
S28G/H31G/S55A/E102A/S103A/T107A
(iDAb LMO2dm6)
Equipment
Haemocytometer (Sigma, catalog number: Z359629)
SpeedVac instrument (any supplier)
Janus liquid handling workstation (PerkinElmer)
Echo Acoustic Dispenser (Labcyte)
CLARIOstar microplate reader including the luminescence module (BMG Labtech)
PHERAstar FSX microplate reader with the BRET2 optic filters (BMG Labtech)
Cell culture 37°C incubator (any supplier)
Centrifuge (any supplier)
Software
MARS Data analysis (BMG Labtech, included with the microplate readers)
Procedure
Construction of iDAb LMO2 mutants (dematuration process)
To set up a BRET-based biosensor capable of monitoring the LMO2-iDAb LMO2 interaction that could be displaced by small molecules, we first constructed various mutants of iDAb LMO2. These mutations were on key residues involved in LMO2 binding and that were on the complementarity determining regions (CDRs) of the iDAb. Here, the aim is to lower the interaction sufficiently (i.e., a dematuration process) to facilitate its inhibition by compounds from a chemical library. We used pEF-GFP2-iDAb LMO2dm-myc (i.e., iDAb LMO2 S55A/T107A) as template (Bery et al., 2018).
Generation of pEF-GFP2-iDAb LMO2 S55A/E102A/T107A-myc vector by polymerase chain reaction (PCR) site-directed mutagenesis:
PCR amplify the iDAb LMO2 S55A/T107A-myc with iDAbPspOMIFor and E102ARev primers and with E102AFor and MyctagstopXbaIRev primers (see Table 2), using Vent DNA polymerase [1 µL of template (20 ng/µL), 5 µL of 10× PCR buffer, 2 µL of dNTP mix (10 mM each), 0.4 µL of MgSO4, 0.6 µL of DMSO, 0.5 µL of each F&R primers (50 µM), 1 µL of Vent DNA polymerase, and 39 µL of dH2O].
PCR: Place at 95°C for 5 min, then 35 cycles of: 94°C for 1 min, 60°C for 1 min, and 72°C for 1 min, followed by a single elongation step of 72°C for 10 min. The annealing temperature varies depending on the primers. This can be checked online: https://tmcalculator.neb.com/#!/main.
Run the two PCR products generated on a 1% agarose gel (120 V, 30 min).
Purify the PCR fragments using the QIAquick gel extraction kit, according to the manufacturer’s instructions, and elute in 30 µL of elution buffer.
PCR assembly of both PCR products following the same protocol from Step A1a-b, using iDAbPspOMIFor and MyctagstopXbaIRev primers.
Run the entire assembled PCR product on a 1% agarose gel (120 V, 30 min).
Purify the PCR fragment using the QIAquick gel extraction kit and elute in 30 µL of elution buffer.
Digest the PCR fragment with PspOMI and XbaI at 37°C for 2 h (1.5 µL of each enzyme, 5 µL of 10× Cutsmart, and 1 µg of PCR product, H2O to 50 µL final volume).
Heat inactivate the digestion at 65°C for 20 min.
Ligate at room temperature (RT: 22°C) for 2 h the digested PCR product (insert) into the pEF-GFP2-MCS vector (Bery and Rabbitts, 2019) [10 ng pEF-GFP2-MCS (NotI/XbaI), 40 ng iDAb LMO2 S55A/E102A/T107A-myc insert, 2 µL of 10× T4 DNA ligase buffer, 1 µL of T4 DNA ligase, H2O to 20 µL final volume].
Add 5 µL of the ligation into 50 µL of DH5α competent cells and leave to transform on ice for 30 min. Heat shock at 42°C for 40 s and then place on ice for 10 min. Add 500 µL of lysogeny broth (LB) medium and shake at 37°C for 1 h. Plate the cells on an LB agar plate with ampicillin (100 µg/mL).
Generate all the other iDAb LMO2 mutants following the same procedure shown in Step A1 and using the primers in Table 2.
Table 2. Primers used for the site-directed mutagenesis to demature iDAb LMO2
iDAbPspOMIFor 5’ TTATTCGGGCCCGTATGGCCGAGGTGCAGCTGTTGG 3’ MyctagstopXbaIRev 5’ TATTAATCTAGACTATGCGGCCCCATTCAGATCC 3’ S28GHFor 5’ CCTCTGGATTCGGCTTCAGTCATAGTCC 3’ S28GHRev 5’ GGACTATGACTGAAGCCGAATCCAGAGG 3’ H31GFor 5’ GGATTCAGCTTCAGTGGCAGTCCTATGAATTGG 3’ H31GRev 5’ CCAATTCATAGGACTGCCACTGAAGCTGAATCC 3’ E102AFor 5’ GAGAGGGTTGACGGCCTCTCTTGAGTTGGC 3’ E102ARev 5’ GCCAACTCAAGAGAGGCCGTCAACCCTCTC 3’ S103AFor 5’ GAGAGGGTTGACGGAGGCGCTTGAGTTGGC 3’ S103ARev 5’ GCCAACTCAAGCGCCTCCGTCAACCCTCTC 3’
BRET2 donor saturation of LMO2/iDAb LMO2 mutants
To check whether iDAb LMO2 mutants interact with LMO2, a donor saturation assay is performed (Figure 1A). This assay will also give insight into the relative affinity of each mutant towards LMO2, as it will be mandatory to determine the right acceptor quantity to express within the cells to avoid the titration of inhibitors in a competition assay (see section C). The whole protocol is performed in a tissue culture hood to maintain sterile conditions.
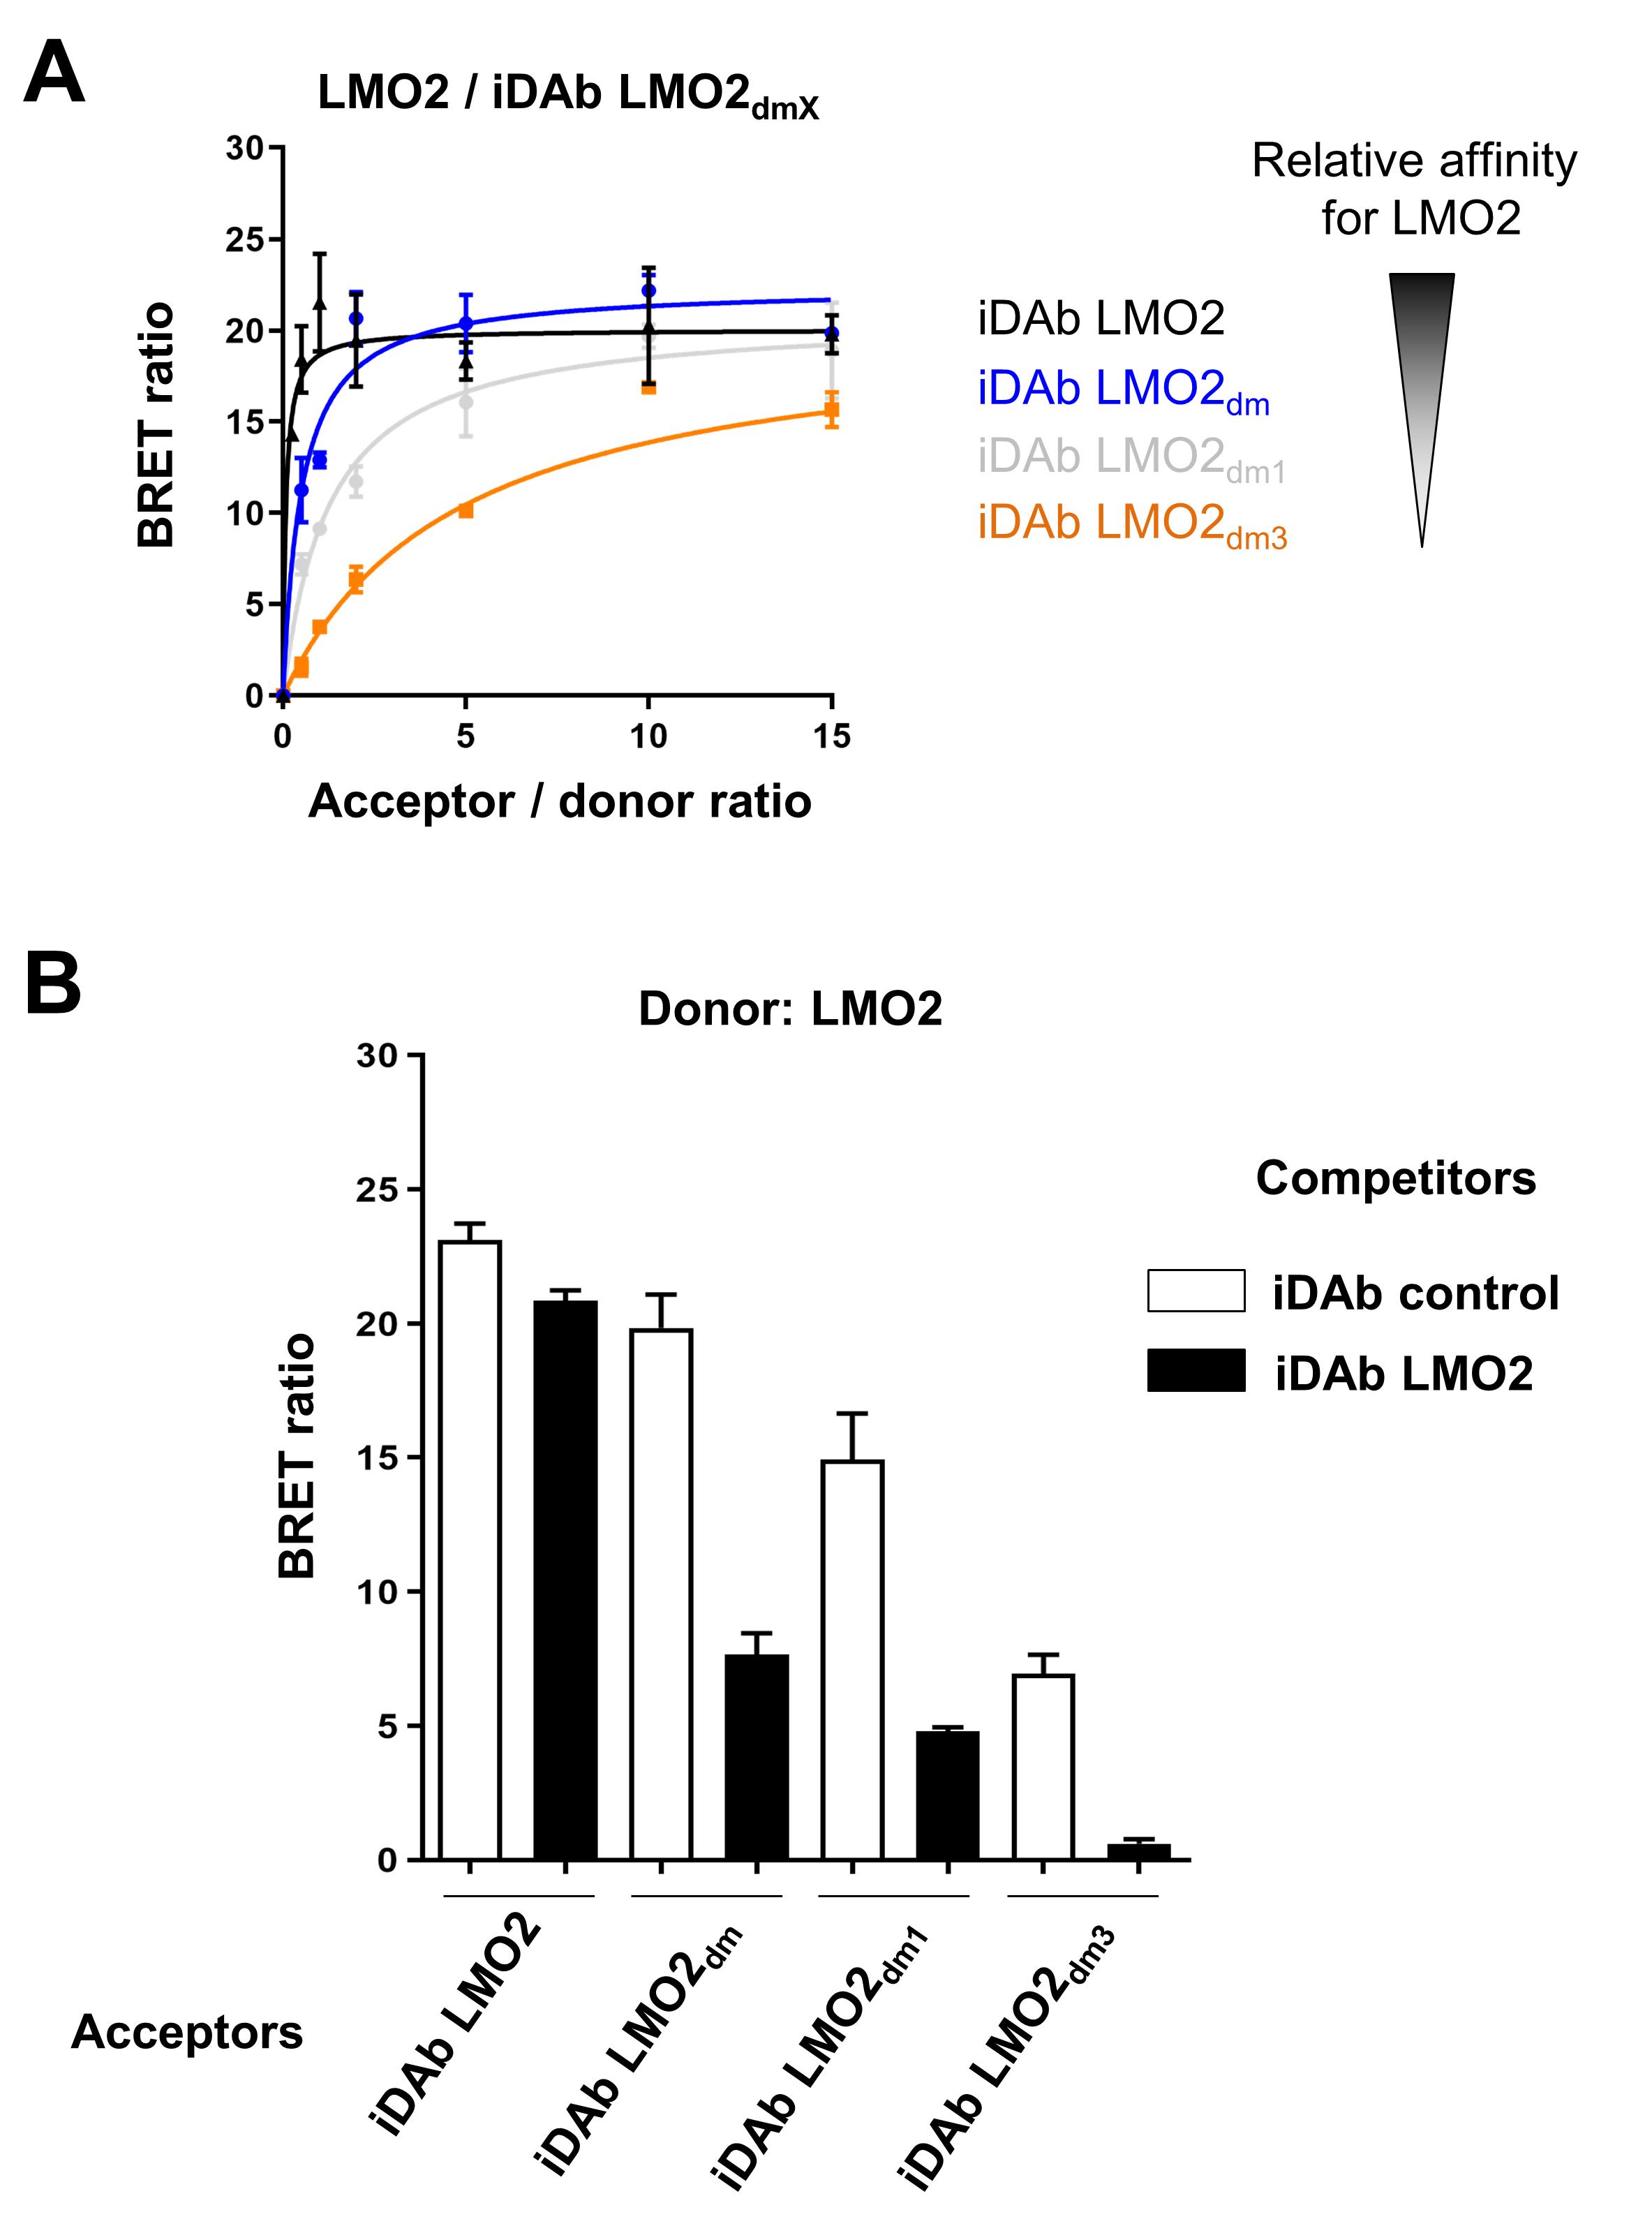
Figure 1. Selection of the optimal iDAb LMO2 mutant for the chemical library screening. A. BRET donor saturation assay between LMO2 (donor) and various iDAb LMO2 mutants obtained after the dematuration process (acceptors). The mutations added within the CDR loops (dematuration) decrease the relative affinity of the corresponding iDAb, as shown by the donor saturation assay. B. BRET competition assay between LMO2 and the different iDAb LMO2 (mutants) to be tested. iDAb control is a non-relevant iDAb (iDAb RAS) and iDAb LMO2 is the wild-type iDAb binding LMO2 with high affinity (positive control).On day 1, plate 650,000 HEK293T cells in each well of a 6-well plate in DMEM medium supplemented with 10% FBS and 1% PS.
On day 2, transfect the cells:
Add in 100 µL of OptiMEM medium: 50 ng RLuc8 construct and varying amount of GFP2 construct: 50, 100, 250, 500, 750 and 1,000 ng. The pEF-myc-cyto empty plasmid is used to equalize the total amount of transfected DNA between each condition (total DNA amount is 1.6 µg).
Add 4 µL of Lipofectamine 2000 transfection reagent in a separate tube with 100 µL of OptiMEM medium.
Add the DNA mix from Step B2a into the Lipofectamine mix from Step B2b, mix, and leave for 20 min at RT.
Add 200 µL of transfection mix into each well.
Incubate the cells for 24 h at 37°C (in a cell culture incubator with 5% CO2).
On day 3, prepare the BRET plate:
Aspirate the medium and add 500 µL of trypsin into each well to detach the cells (2 min at RT).
Neutralize the trypsin with 1 mL of complete DMEM (with 10% FBS).
Count the cells of one or two conditions (assuming that the cell number is equivalent between each condition after checking under the microscope).
Add 500,000 cells and 1 mL of PBS in a 15-mL Falcon tube.
Centrifuge at 240 × g and 20°C for 5 min, and aspirate the supernatant.
Add 1 mL of OptiMEM no phenol red supplemented with 4% FBS (BRET medium) and carefully resuspend the cells.
Add 100 µL of cell suspension per well of a white clear bottom 96-well plate (make quadruplicates for each condition).
Leave the cells at 37°C (in a cell culture incubator with 5% CO2) for 20 h before performing the BRET reading.
BRET2 competition assay
After the donor saturation assay described in section B, a competition assay is performed to (i) check the specificity of the interaction, and (ii) determine the optimal dematured iDAb that will be used for the chemical library screen. In that case, the optimal mutant iDAb displays a high BRET signal, but its interaction with LMO2 has to be almost fully inhibited by the wild-type iDAb LMO2 in a competition assay (Figure 1B). This protocol is performed in a tissue culture hood to maintain sterile conditions.
On day 1, plate 650,000 HEK293T cells in each well of a 6-well plate in DMEM medium supplemented with 10% FBS and 1% PS.
On day 2, transfect the cells:
Add in 100 µL of OptiMEM medium: 50 ng LMO2-RLuc8 construct, 100 ng of GFP2-iDAb LMO2 mutants construct with 100 ng of pEF-iDAb competitor (always use a negative control (i.e., iDAb RAS in a competition assay). The pEF-myc-cyto empty plasmid is used to equalize the total amount of transfected DNA between each condition (total DNA amount is 1.6 µg).
Add 4 µL of Lipofectamine 2000 transfection reagent in a separate tube with 100 µL of OptiMEM medium.
Add the DNA mix from Step C2a into the Lipofectamine mix from Step C2b, mix, and leave for 20 min at RT.
Add 200 µL of transfection mix into each well.
Incubate the cells at 37°C (in a cell culture incubator with 5% CO2) for 24 h.
On day 3, prepare the BRET plate as described in Step B3.
BRET2 measurements
Note: This step does not require sterile tissue culture hood use.
Resuspend an aliquot of Coelenterazine 400a (BRET substrate) in 500 µL of 100% ethanol.
Add 750 µL of BRET medium to make 1.25 mL of BRET substrate at 100 µM.
Read the GFP2 fluorescence first on a CLARIOstar instrument with the following settings: excitation 395 ± 30 nm and emission 510 ± 40 nm.
Tape the bottom of the 96-well plate with a white tape before the BRET reading (otherwise a loss of signal is observed).
Link the resuspended BRET substrate with the pump/injector of the CLARIOstar.
Read the BRET signal with a CLARIOstar instrument equipped with a luminescence module. Set up a luminescence protocol with two multichromatics and use the following monochromator settings: 410 ± 40 nm (emission 1) and 515 ± 15 nm (emission 2), which are needed to determine the BRET signal (see data analysis section for BRET signal calculation). Read the plate in well mode, which is performed at RT: 10 µL of substrate is injected in well A1, the BRET signal read in well A1, then the substrate is injected in well A2, and the BRET signal read in well A2, until the last selected well on your plate.
Read the RLuc8 signal at 480 ± 40 nm.
High throughput chemical screening (HTS) with LMO2/iDAb LMO2 mutant BRET biosensor
Once the mutant has been validated, it can be used for the HTS assay. Several parameters have to be optimized or tested before starting the HTS assay, such as the stability of the BRET substrate at RT, the miniaturization of the assay (from 96-well plate to 384-well plate format), and the scaling up of the transfection of HEK293T cells with the BRET pair to obtain a number of cells sufficient for the HTS assay (Figure 2A and 2B). The screen was performed with an in-house library of 10,720 compounds from BioFocus and Chembridge libraries compressed into 384-well plate format at 10 µM. Two sessions of HTS, containing 5,360 compounds each, were performed in 68 assay plates (34 plates in duplicate) because of timing/handling purposes. The protocol for one session of 34 plates is described below.
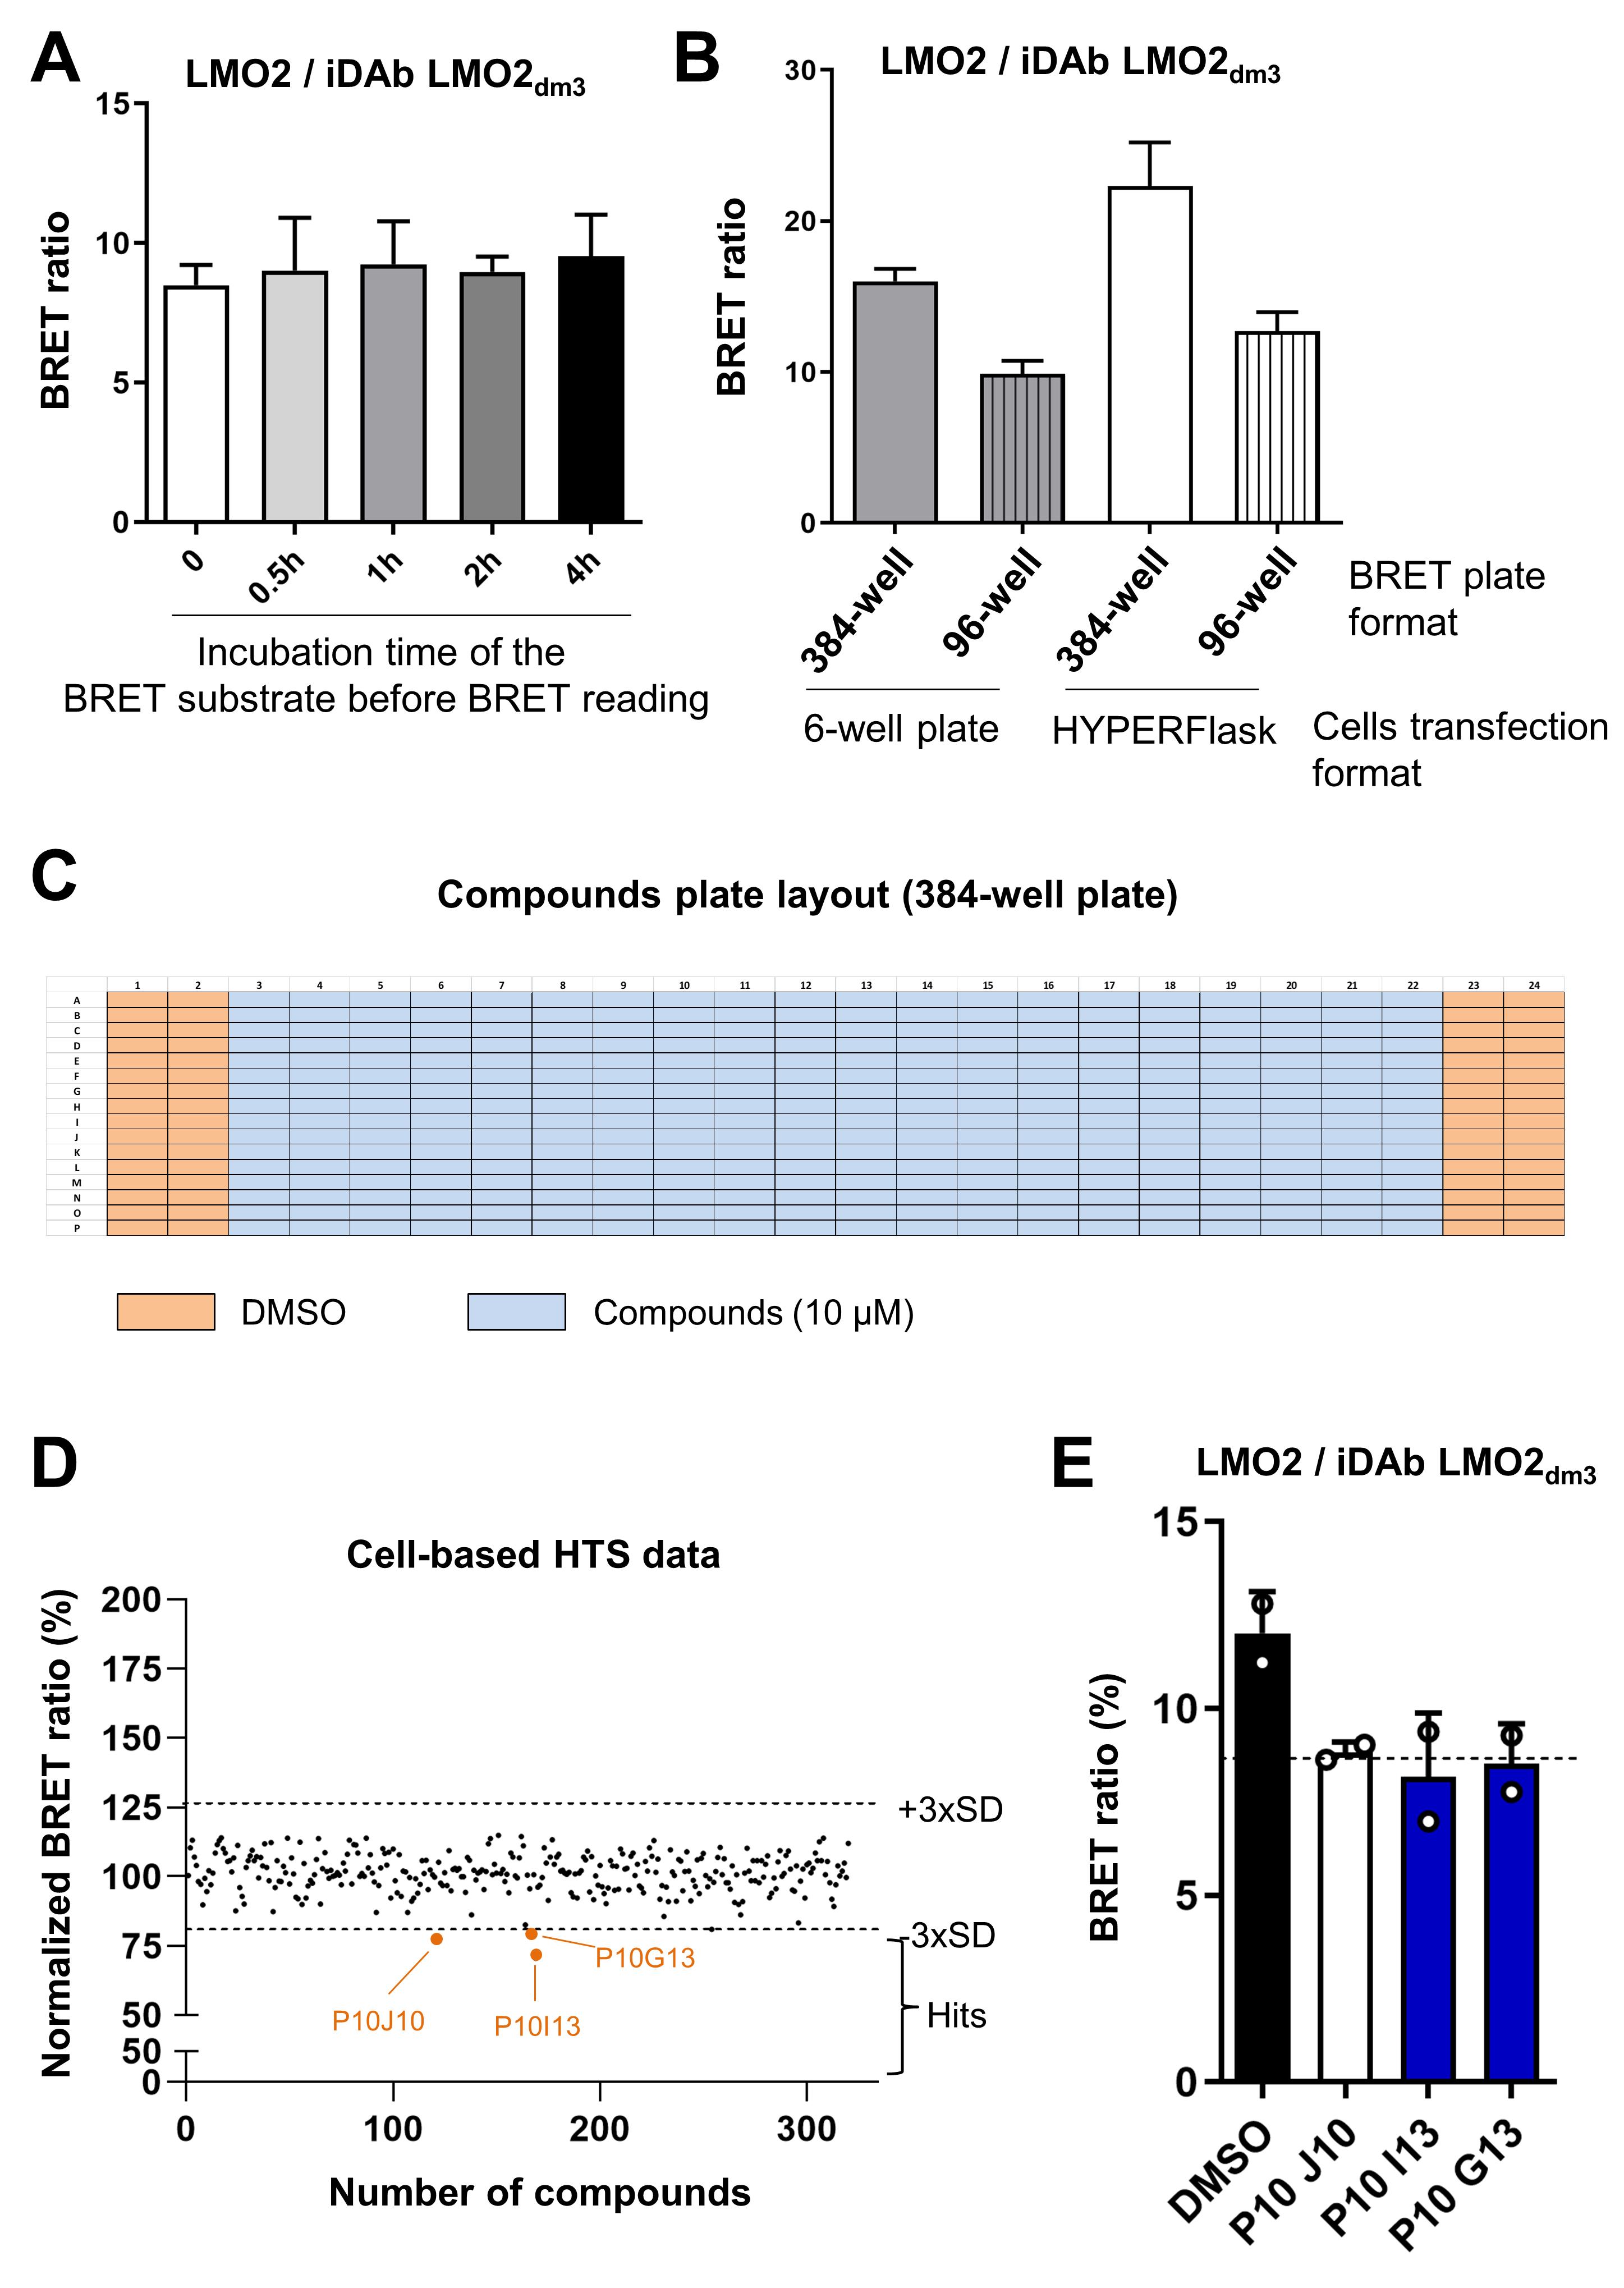
Figure 2. Optimisation and implementation of the cell-based high-throughput screening assay to identify inhibitors of LMO2/iDAb LMO2 PPI. A. BRET signal of LMO2/iDAb LMO2dm3 interaction using the BRET substrate that was incubated at RT for the indicated time (protected from light). B. Impact on the BRET signal when scaling up the cell transfection format (from 6-well plate to HYPERFlask) and miniaturising the assay for HTS (from 96-well plate to 384-well plate format). 20,000 and 50,000 cells were plated per well of a 384-well plate and a 96-well plate respectively. C. HTS compounds 384-well plate layout. D. Representative data from the cell-based HTS. These data are from one 384-well plate that includes 3 potential hits indicated in orange [below the threshold of 3 × standard deviations (SD) of the BRETDMSO (mean)]. E. Confirmation of the primary hits at 10 µM by BRET competition assay with the LMO2/iDAb LMO2dm3 pair. Two hits are confirmed to inhibit the LMO2/iDAb LMO2dm3 interaction and are depicted by blue bars. The threshold [BRETDMSO (mean) ± 3×SD] is shown with the dotted line.On day 1, inoculate 120 × 106 HEK293T cells per HYPERFlask. Two HYPERFlasks are needed for one HTS session (i.e., 240 × 106 HEK293T cells in total). The surface of one HYPERFlask corresponds to the surface of ~10 × T175. Fill the HYPERFlask with medium (up to 560 mL, which is the maximal volume of an HYPERFlask).
Note: Be careful when filling the HYPERFlask with medium, as it is easy to make lots of air bubbles that need to be avoided for proper cell growth. Always fill the HYPERFlask up to the lid to avoid air bubbles.
On day 2, transfect the cells in the HYPERFlasks with the BRET pair pEF-LMO2-RLuc8 and pEF-GFP2-iDAb LMO2dm3. For one HYPERFlask:
In a 15 mL Falcon tube, add in 10 mL of OptiMEM: 19 µg of pEF-LMO2-RLuc8, 37 µg of pEF-GFP2-iDAb LMO2dm3, and 244 µg of pEF-myc-cyto empty plasmids.
In a separate 50 mL Falcon tube, add 750 µL of Lipofectamine 2000 in 10 mL of OptiMEM, and mix gently by vortexing for 5 s.
Add the DNA mix from Step E2a into the Lipofectamine mix from Step E2b, vortex gently for 5 s, and wait for 20 min.
Add this mix (DNA+Lipofectamine) into 500 mL of complete DMEM, gently mix the medium, and pour it into a sterile beaker. Remove the medium for the HYPERFlask and pour the transfection mix into the HYPERFlask carefully without any bubbles. Complete with medium until the top of the flask.
Note: The use of a beaker avoids the formation of bubbles when pouring the medium into the HYPERFlask.
On day 3 (morning, 24 h after the transfection), harvest the transfected cells:
Add 100 mL of trypsin per HYPERFlask (i.e., 200 mL in total).
Incubate the flasks at 37°C, for 2 min.
Transfer the trypsinised cells into a sterile beaker alreay containing 100 mL of complete medium.
Wash each flask with 100 mL of complete medium and pour it into the beaker (final volume of 300 mL for one flask). Pull all the cells in one beaker (final volume of 600 mL).
Mix gently but thoroughl,y to ensure a good dissociation of the cells.
Count the cells.
Add 90 × 106 cells per 250 mL Corning centrifuge tube, and prepare 4 centrifuge tubes, corresponding to 360 × 106 transfected cells in total.
Centrifuge the cells at 220 × g and 20°C for 5 min.
Remove the supernatant carefully and resuspend each cell pellet with 200 mL of BRET medium supplemented with 1% PS (4 pellets in total). This corresponds to a concentration of 0.45 × 10⁶ cells/mL.
Seed 45 µL of cell suspension per well of a white 384-well plate with a PerkinElmer Janus liquid handling workstation housed in a category 2 enclosure. It takes around 10 min to seed 6 × 384-well plates with this equipment.
Note: Run an unused plate first to remove all the remaining air bubbles from the liquid handling workstation. Gently mix the cells with a magnetic stirbar while dispensing them into the 384-well plate to keep them dissociated, as HEK293T might have a tendency to form aggregates that could clog the workstation.
Leave the plates on a flat surface for 20 min before incubating them into a cell culture incubator at 37°C with 5% CO2 for 24 h. This step will ensure a homogenous plating of the cells through each well.
On day 3 (beginning of the afternoon), dilute the chemical library (initial concentration of 10 mM) to 100 µM.
Add 150 nL of each compound into 15 µL of BRET medium using an Echo Acoustic Dispenser (Labcyte).
On day 3 (late afternoon), add the compounds to the cells.
Add 5 µL of 1% DMSO (prepared in BRET medium) in the columns 1, 2, 23, and 24 as negative controls (Figure 2C).
Add 5 µL of compounds at a concentration of 100 µM to cells in each well using the PerkinElmer Janus liquid handling workstation (final concentration in each well: 10 µM, 0.1% DMSO).
Incubate the plate at 37°C (cell culture incubator with 5% CO2) for 20 h.
On day 4, plate reading (morning, for 20 h of incubation).
Read the GFP2 signal of each plate before the BRET2 reading with a PHERAstar FSX plate reader.
After the GFP2 reading, tape the bottom of the 384-well plate with a white tape (furnished with the plates).
Prepare 80 mL of 100 µM BRET substrate: dissolve 3 mg of coelenterazine 400a with 32 mL of 100% ethanol, then complete to 80 mL by adding 48 mL of BRET medium.
Read the BRET2 signal using a BRET2 optic module with the PHERAstar FSX plate reader: inject 5.5 µL of BRET substrate (final concentration of 10 µM) into a well, read the BRET2 signal 0.2 s after the injection for 1 s, inject into another well, and read the BRET2 signal with the same settings.
The reading time for one 384-well plate is around 8 min. It takes ~4.5 h to read 34 plates (see data analysis section for the HTS plates analysis and hits determination, Figure 2D).
Note: All the steps described in the section E are done under a tissue culture hood to maintain sterility except steps 4 and 6.
Confirmation of primary hits
After HTS assay, we identified 34 primary hits that decreased the BRET ratio emanating from the interaction LMO2 / iDAb LMO2dm3. The next step is to re-test these compounds with the same BRET assay than the HTS to check if these are genuine hits (Figure 2E). Below is the protocol for performing a competition assay with the BRET pair LMO2/iDAb LMO2dm3 in a full 96-well plate. It can be scaled up depending on the number of compounds to be tested.
On day 1, plate 650,000 HEK293T cells in each well of a 6-well plate as done in Step C1.
On day 2, transfect the cells:
In 100 µL of OptiMEM medium, add 50 ng LMO2-RLuc8 construct and 100 ng of GFP2-iDAb LMO2dm3 construct with 1,450 ng of the pEF-myc-cyto empty plasmid (the total DNA amount is 1.6 µg).
Add 4 µL of Lipofectamine 2000 transfection reagent in a separate tube with 100 µL of OptiMEM medium.
Add the DNA mix from Step F2a into the Lipofectamine mix from Step F2b, mix, and leave for 20 min at RT.
Add 200 µL of transfection mix into each well.
Incubate the cells for 24 h at 37°C (in a cell culture incubator with 5% CO2).
Note: Four transfected wells of a 6-well plate typically yield enough cells to perform a competition assay in a full 96-well plate.
On day 3, prepare the BRET plate:
Aspirate the medium and add 500 µL of trypsin into each well to detach cells (2 min at RT).
Neutralize the trypsin with 1 mL of complete DMEM (with 10% FBS).
Pool the cells in a 15 mL Falcon and count the cells.
Add 5 million cells in a new 15 mL Falcon tube and add 5 mL of PBS.
Centrifuge at 240 × g and 20°C for 5 min, and aspirate the supernatant.
Add 12 mL of BRET medium and carefully resuspend the cells.
Seed 90 µL of cells (≈ 38,000 cells) per well of a white clear bottom 96-well plate.
Leave the cells for 4 h at 37°C in a cell culture incubator with 5% CO2, before the addition of the compounds.
On day 3, prepare the compounds:
Dilute 10 mM stock of the compounds in 100% DMSO in BRET medium to reach 100 µM, 2% DMSO (10× the assay concentration which is 10 µM).
Add 10 µL of 10× compounds in each well of the 96-well plate including a DMSO negative control. The final concentration in the well is 10 µM, 0.2% DMSO. Perform quadruplicates for each point.
Incubate the cells at 37°C for an additional 20 h before the BRET reading.
On day 4, read the BRET signal as described in section D.
Note: All the steps described in the section F are done under a tissue culture hood to maintain sterility except step 5 (BRET reading).
Data analysis
BRET ratio calculation for donor saturation and competition assays
The BRET signal or BRET ratio corresponds to the light emitted by the GFP2 acceptor construct (515 ± 15 nm) after addition of Coelenterazine 400a, divided by the light emitted by the RLuc8 donor construct (410 ± 40 nm). The donor-only negative control where only the RLuc8 plasmid is transfected into the cells and gives a background signal that is subtracted from the BRET ratio. Using the CLARIOstar and PHERAstar instruments, we multiplied the value of the BRET ratio by 100 to get whole numbers (above 1).
For the titration curves, the results are analyzed by nonlinear regression assuming a hyperbolic model.
BRET ratio normalization for the competition assays
In a BRET competition assay, the data are normalized to a negative control (e.g., no competitor or non-LMO2 binder for iDAbs and DMSO for small molecules) to compare the effect of a competitor (iDAb or small molecules). The normalized BRET ratio is calculated as follows:
BRETcompound / BRETDMSO × 100
BRETiDAb LMO2 / BRETiDAb control × 100
BRETiDAb LMO2 / BRETno competitor × 100,
where BRETcompound corresponds to the BRET ratio for the compound-treated cells, BRETDMSO corresponds to the BRET ratio for DMSO-treated cells, BRETiDAb LMO2 corresponds to the anti-LMO2 iDAb (mutants) transfected cells, BRETiDAb control corresponds to the negative control iDAb transfected cells (non-LMO2 binder, e.g., anti-RAS iDAb), and BRETno competitor corresponds to the cells not transfected with a competitor.
HTS data calculation
Analyse the HTS data with MARS Data analysis software. The BRET ratio is calculated as indicated in A, without the removal of the donor only signal.
Analyse the hits for each plate:
Calculate the BRET ratio mean of all the DMSO treated wells (negative control) from one plate ± SD. Therefore, one BRETDMSO (mean) is calculated per plate.
Normalize the BRET ratio data of all the compounds to the BRETDMSO (mean) of the same plate.
Because no positive hits were available, a hit was defined as showing a normalized BRET ratio below the BRETDMSO (mean) – 3×SD.
A positive hit is a compound that shows a BRET ratio below the indicated threshold in both duplicate plates (Figure 2D).
From over 10,720 screened compounds, 34 hits were identified. A hit rate of 0.3% was obtained with this HTS.
Recipes
BRET medium
OptiMEM no phenol red + 4% FBS (+ 1% PS, for the HTS assay).
BRET substrate
Resuspend 1 mg of Coelenterazine 400a in 10.2 mL of 100% ethanol to make a 250 μM solution.
Divide this solution into 20 aliquots of 500 μL.
Evaporate the ethanol from the solution with a SpeedVac instrument and store aliquots at -80°C (stable up to 1 year at −80°C when dry).
One aliquot is enough to read one 96-well plate. Coelenterazine 400a substrate is light sensitive, protect from light with aluminum foil.
Acknowledgments
NB is supported by a fellowship from the Fondation de France (n°00097692).
THR is supported by the Institute of Cancer Research and by Blood Cancer UK. The work for this protocol was supported by the Bloodwise Programme grant 12051.
This work was originally published as a research article in the journal Science Advances (DOI: 10.1126/sciadv.abg1950).
Competing interests
The authors declare that they have no competing interests.
References
- Bery, N., Bataille, C. J. R., Russell, A., Hayes, A., Raynaud, F., Milhas, S., Anand, S., Tulmin, H., Miller, A. and Rabbitts, T. H. (2021). A cell-based screening method using an intracellular antibody for discovering small molecules targeting the translocation protein LMO2. Sci Adv 7(15): eabg1950.
- Bery, N., Cruz-Migoni, A., Bataille, C. J., Quevedo, C. E., Tulmin, H., Miller, A., Russell, A., Phillips, S. E., Carr, S. B. and Rabbitts, T. H. (2018). BRET-based RAS biosensors that show a novel small molecule is an inhibitor of RAS-effector protein-protein interactions. Elife 7: e37122.
- Bery, N., Keller, L., Soulie, M., Gence, R., Iscache, A. L., Cherier, J., Cabantous, S., Sordet, O., Lajoie-Mazenc, I., Pedelacq, J. D., et al. (2019a). A Targeted Protein Degradation Cell-Based Screening for Nanobodies Selective toward the Cellular RHOB GTP-Bound Conformation. Cell Chem Biol 26(11): 1544-1558 e1546.
- Bery, N., Legg, S., Debreczeni, J., Breed, J., Embrey, K., Stubbs, C., Kolasinska-Zwierz, P., Barrett, N., Marwood, R., Watson, J., Tart, J., Overman, R., Miller, A., Phillips, C., Minter, R. and Rabbitts, T. H. (2019b). KRAS-specific inhibition using a DARPin binding to a site in the allosteric lobe. Nat Commun 10(1): 2607.
- Bery, N. and Rabbitts, T. H. (2019). Bioluminescence Resonance Energy Transfer 2 (BRET2)-Based RAS Biosensors to Characterize RAS Inhibitors. Curr Protoc Cell Biol 83(1): e83.
- Guillard, S., Kolasinska-Zwierz, P., Debreczeni, J., Breed, J., Zhang, J., Bery, N., Marwood, R., Tart, J., Overman, R., Stocki, P., et al. (2017). Structural and functional characterization of a DARPin which inhibits Ras nucleotide exchange. Nat Commun 8: 16111.
- Quevedo, C. E., Cruz-Migoni, A., Bery, N., Miller, A., Tanaka, T., Petch, D., Bataille, C. J. R., Lee, L. Y. W., Fallon, P. S., Tulmin, H., et al. (2018). Small molecule inhibitors of RAS-effector protein interactions derived using an intracellular antibody fragment. Nat Commun 9(1): 3169.
- Tanaka, T., Sewell, H., Waters, S., Phillips, S. E. and Rabbitts, T. H. (2011). Single domain intracellular antibodies from diverse libraries: emphasizing dual functions of LMO2 protein interactions using a single VH domain. J Biol Chem 286(5): 3707-3716.
- Tanaka, T., Thomas, J., Van Montfort, R., Miller, A. and Rabbitts, T. (2021). Pan RAS-binding compounds selected from a chemical library by inhibiting interaction between RAS and a reduced affinity intracellular antibody. Sci Rep 11(1): 1712.
- Tanaka, T., Williams, R. L. and Rabbitts, T. H. (2007). Tumour prevention by a single antibody domain targeting the interaction of signal transduction proteins with RAS. EMBO J 26(13): 3250-3259.
Article Information
Publication history
Accepted: Oct 27, 2021
Published: Feb 20, 2022
Copyright
© 2022 The Authors; exclusive licensee Bio-protocol LLC.
How to cite
Readers should cite both the Bio-protocol article and the original research article where this protocol was used:
- Bery, N. and Rabbitts, T. H. (2022). A Cell-based Screening Method Using an Intracellular Antibody for Discovering Small Molecules Targeting Hard-to-drug Proteins. Bio-protocol 12(4): e4324. DOI: 10.21769/BioProtoc.4324.
- Bery, N., Bataille, C. J. R., Russell, A., Hayes, A., Raynaud, F., Milhas, S., Anand, S., Tulmin, H., Miller, A. and Rabbitts, T. H. (2021). A cell-based screening method using an intracellular antibody for discovering small molecules targeting the translocation protein LMO2. Sci Adv 7(15): eabg1950.
Category
Cancer Biology > Cancer biochemistry
Drug Discovery > Drug Design
Cell Biology > Cell-based analysis
Do you have any questions about this protocol?
Post your question to gather feedback from the community. We will also invite the authors of this article to respond.
![]() Tips for asking effective questions
Tips for asking effective questions
+ Description
Write a detailed description. Include all information that will help others answer your question including experimental processes, conditions, and relevant images.