
- Submit a Protocol
- Receive Our Alerts
- EN

- Protocols

- Articles and Issues
- For Authors
- About
- Become a Reviewer

Measuring Endogenous GA and IAA

Published: Vol 12, Iss 4, Feb 20, 2022 DOI: 10.21769/BioProtoc.4332 Views: 1960
Reviewed by: Yuan WangYe XuAnonymous reviewer(s)
Original research article
The authors used this protocol in:
Sep 2020

Protocol Collections
Comprehensive collections of detailed, peer-reviewed protocols focusing on specific topics

Abstract
Plant hormones regulate many physiological processes that largely influence growth, differentiation, and development. Contents of phytohormones were analyzed using a liquid chromatography-electrospray ionization-tandem mass spectrometry (LC-ESI-MS/MS) system. This protocol describes a detailed procedure to extract and quantify indole-3-acetic acid (IAA) and gibberellin acid (GA) in rice (Oryza sativa) tissues using high-performance liquid chromatography (HPLC)-based method.
Keywords: PhytohormonesBackground
Plant hormones are the trace organic substances synthesized in plants that are transported from the synthetic site to the active site to significantly regulate plant growth and development (Luo et al., 2016; Chen et al., 2020a and 2020b). Generally, plant hormones are classified according to their molecular structure and physiological function: auxins, cytokinins (CKs), abscisic acid (ABA), jasmonates (JA), salicy acid (SA), gibberellines (GAs), brassinasteroids (BRs), ethylene (ET), etc. The regulation of plant hormones to plant physiological activities involves the change of their own concentration. Uncovering the composition and content changes in plant hormones enables the discovery of possible mechanisms of action and more interactions between them. There are many methods to detect plant hormones, based on as enzyme-linked immunosorbent assays (ELISA), gas chromatography (GC), and high-performance liquid chromatography (HPLC) (Owen and Abrams, 2009; Prado et al., 2014). Nowadays, LC-MS and GC-MS have overcame the limitations of HPLC and GC in the qualitative and quantitative determination of plant hormones and become widely accepted and recognized methods.
Materials and Reagents
Centrifuge tubes (Eppendorf) (1.5 mL) (CAS 0030125150)
Ethanol (CAS 64-17-5), methyl alcohol (CAS 78-83-1), acetonitrile (CAS 75-05-8) (http://www.merck-chemicals.com)
Ultrapure water (Millipore, Bedford, MA)
Standards: IAA, GA (Olchemim Ltd) IAA (CAS 87-51-4); ME-IAA (CAS 1912-33-0); GA1 (CAS 545-97-1); GA3 (CAS 77-06-5); GA4 (CAS 468-44-0); GA7 (CAS 510-75-8); GA8 (CAS 7044-72-6)
Acetic acid (Sinopharm Chemical Reagent, Shanghai, China)
Liquid nitrogen
Mobile phase (see Recipes)
Organic phase (see Recipes)
Equipment
Scissors
UPLC (Ultra Performance Liquid Chromatography), Shim-pack UFLC SHIMADZU CBM20A, http://www.shimadzu.com.cn
MS/MS (Tandem mass spectrometry), Applied Biosystems 4500 QTRAP, http://www.appliedbiosystems.com.cn
WatersACQUITY UPLC HSS T3 C18, 1.8 µm, 2.1 mm * 100 mm
Software
Analyst 1.6 software (AB Sciex)
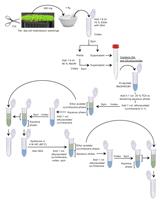
Procedure
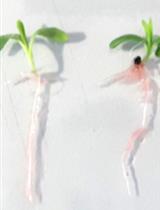
Plant 15 rice seeds of the transgenic plants in a container filled with soil with 2 × 2-cm spacing in a phytotron. The phytotron is set at 30°C and 70% humidity with an 8 h light/16 h dark photoperiod.
Harvest fresh 15-day-old seedlings, weight them, and then immediately ground them into powder in liquid nitrogen. Since tissue close to the soil may be contaminated, remove a length of approximately 0.5 cm of tissue near the soil with scissors.
Use 100 mg of the powder for subsequent phytohormone extraction, with 1 mL of 80 % (v/v) methanol at 4°C for 12 h.
Rotate the extract three times and centrifuge at 12,000 × g and 4°C for 15 min.
Collect the supernatant and evaporate it to dryness under a nitrogen gas stream at 35°C. Reconstitute the dry supernatant in 100 mL of 95% (v/v) acetonitrile.
Centrifuge the solution at 12,000 × g and 4°C for 15 min and collect the supernatant for liquid chromatography-mass spectrometry analysis.
Prepare quality control (QC) samples from a mixture of sample extracts for analysis of samples under the same treatment method. To assess the repeatability of the analysis procedure, over the course of instrumental analysis, insert one QC sample for every ten test samples.
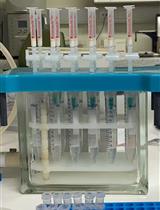
Analyze the sample extracts using an LC-ESI-MS/MS system, using the following analytical conditions: HPLC: column, Waters ACQUITY UPLC HSS T3 C18 (1.8 μm, 2.1 mm*100 mm); solvent system: water (0.1% acetic acid): acetonitrile (0.1% acetic acid); gradient program: 100:0 V/V at 0 min, 5:95 V/V at 11.0 min, 5:95 V/V at 12.0 min, 95:5 V/V at 12.1 min, and 95:5 V/V at 15.0 min; flow rate: 0.40 mL/min; temperature: 40°C; injection volume: 5 μL. The effluent was alternatively connected to an ESI-triple quadrupole-linear ion trap (Q TRAP)-MS.
Acquire LIT and triple quadrupole (QQQ) scans on a triple quadrupole-linear ion trap mass spectrometer (Q TRAP), API 4500 Q TRAP LC/MS/MS System, equipped with an ESI Turbo Ion-Spray interface, operating in a positive ion mode, and controlled by Analyst 1.6 software (AB Sciex). The ESI source operation parameters were as follows: ion source: turbo spray; source temperature: 550°C; ion spray voltage (IS): 5,500 V; ion source gas I (GSI), gas II (GSII), and curtain gas (CUR) were set at 55, 60, and 25.0 psi, respectively; the collision gas (CAD) was high. Instrument tuning and mass calibration were performed with 10 and 100 μmol/L polypropylene glycol solutions, in QQQ and LIT modes, respectively. Acquire QQQ scans as MRM experiments with collision gas (nitrogen) set to 5 psi. DP and CE for individual MRM transitions were done with further DP and CE optimization. Monitor a specific set of MRM transitions for each period, according to the plant hormones eluted within this period.
Data analysis
Three biological replicates were used for the quantification of IAAs and GAs.
Perform qualitative analysis on the first and second spectrum data of mass spectrometric detection, based on the self-built database and the public database of metabolite information.
Recipes
Mobile phase
Ultrapure water with 0.1% methanoic acid (99.9 mL of ultrapure water and 0.1 mL of methanoic acid).
Organic phase
Acetonitrile with 0.1% methanoic acid (99.9 mL of acetonitrile and 0.1 mL of methanoic acid).
Acknowledgments
This work was supported by the National Key Research and Development Program (grant no. 2016YFD0100903), the National Transgenic Research and Development Program (grant no. 2016ZX08001004–001–002), and the National Natural Science Foundation of China (grant no. 31870322). This protocol is established based on the Methods section in our previous publication (doi: https://doi.org/10.1104/pp.20.00302) with minor modifications.
Competing interests
The authors declare no financial or non-financial competing interests.
References
- Chen, Y., Dan, Z., Gao, F., Chen, P., Fan, F. and Li, S. (2020a). Rice GROWTH-REGULATING FACTOR7 Modulates Plant Architecture through Regulating GA and Indole-3-Acetic Acid Metabolism. Plant Physiol 184(1): 393-406.
- Chen, Y., Dan, Z. and Li, S. (2020b). Rice GROWTH-REGULATING FACTOR 7 controls tiller number by regulating strigolactone synthesis. Plant Signal Behav 15(11): 1804685.
- Luo, X., Zheng, J., Huang, R., Huang, Y., Wang, H., Jiang, L. and Fang, X. (2016). Phytohormones signaling and crosstalk regulating leaf angle in rice. Plant Cell Rep 35(12): 2423-2433.
- Owen, S. J. and Abrams, S. R. (2009). Measurement of plant hormones by liquid chromatography-mass spectrometry. Methods Mol Biol 495: 39-51.
- Prado, M. J., Largo, A., Dominguez, C., Gonzalez, M. V., Rey, M. and Centeno, M. L. (2014). Determination of abscisic acid and its glucosyl ester in embryogenic callus cultures of Vitis vinifera in relation to the maturation of somatic embryos using a new liquid chromatography-ELISA analysis method. J Plant Physiol 171(10): 852-859.
Article Information
Publication history
Accepted: Jan 4, 2022
Published: Feb 20, 2022
Copyright
© 2022 The Authors; exclusive licensee Bio-protocol LLC.
How to cite
Readers should cite both the Bio-protocol article and the original research article where this protocol was used:
- Chen, Y., Dan, Z. and Li, S. (2022). Measuring Endogenous GA and IAA. Bio-protocol 12(4): e4332. DOI: 10.21769/BioProtoc.4332.
- Chen, Y., Dan, Z., Gao, F., Chen, P., Fan, F. and Li, S. (2020a). Rice GROWTH-REGULATING FACTOR7 Modulates Plant Architecture through Regulating GA and Indole-3-Acetic Acid Metabolism. Plant Physiol 184(1): 393-406.
Category
Plant Science > Plant biochemistry > Plant hormone
Do you have any questions about this protocol?
Post your question to gather feedback from the community. We will also invite the authors of this article to respond.
![]() Tips for asking effective questions
Tips for asking effective questions
+ Description
Write a detailed description. Include all information that will help others answer your question including experimental processes, conditions, and relevant images.