
- Submit a Protocol
- Receive Our Alerts
- EN

- Protocols

- Articles and Issues
- For Authors
- About
- Become a Reviewer

Laser Microirradiation and Real-time Recruitment Assays Using an Engineered Biosensor
Published: Vol 12, Iss 5, Mar 5, 2022 DOI: 10.21769/BioProtoc.4337 Views: 2438
Reviewed by: Chiara AmbrogioAnonymous reviewer(s)
Original research article
The authors used this protocol in:

Apr 2021

Protocol Collections
Comprehensive collections of detailed, peer-reviewed protocols focusing on specific topics


Related protocols
Abstract
Double-strand breaks (DSBs) are lesions in DNA that, if not properly repaired, can cause genomic instability, oncogenesis, and cell death. Multiple chromatin posttranslational modifications (PTMs) play a role in the DNA damage response to DSBs. Among these, RNF168-mediated ubiquitination of lysines 13 or 15 at the N-terminal tail of histone H2A (H2AK13/15Ub) is essential for the recruitment of effectors of both the non-homologous end joining (NHEJ) and the homologous recombination (HR) repair pathways. Thus, tools and techniques to track the spatiotemporal dynamics of H2AK13/15 ubiquitination at DNA DSBs are important to facilitate studies of DNA repair. Previous work from other groups used the minimal focus-forming region (FFR) of the NHEJ effector 53BP1 to detect H2AK15Ub generated upon damage induced by gamma or laser irradiation in live cells. However, 53BP1-FFR only binds nucleosomes modified with both H2AK15Ub and dimethylation of lysine 20 on histone H4 (H4K20me2); thus, 53BP1-FFR does not recognize H2AK13Ub–nucleosomes or nucleosomes that contain H2AK15Ub but lack methylation of H4K20 (H4K20me0). To overcome this limitation, we developed an avidity-based sensor that binds H2AK13/15Ub without dependence on the methylation status of histone H4K20. This sensor, called Reader1.0, detects DNA damage-associated H2AK13/15Ub in live cells with high sensitivity and selectivity. Here, we present a protocol to detect the formation of H2AK13/15Ub at laser-induced DSBs using Reader1.0 as a live-cell reporter for this histone PTM.
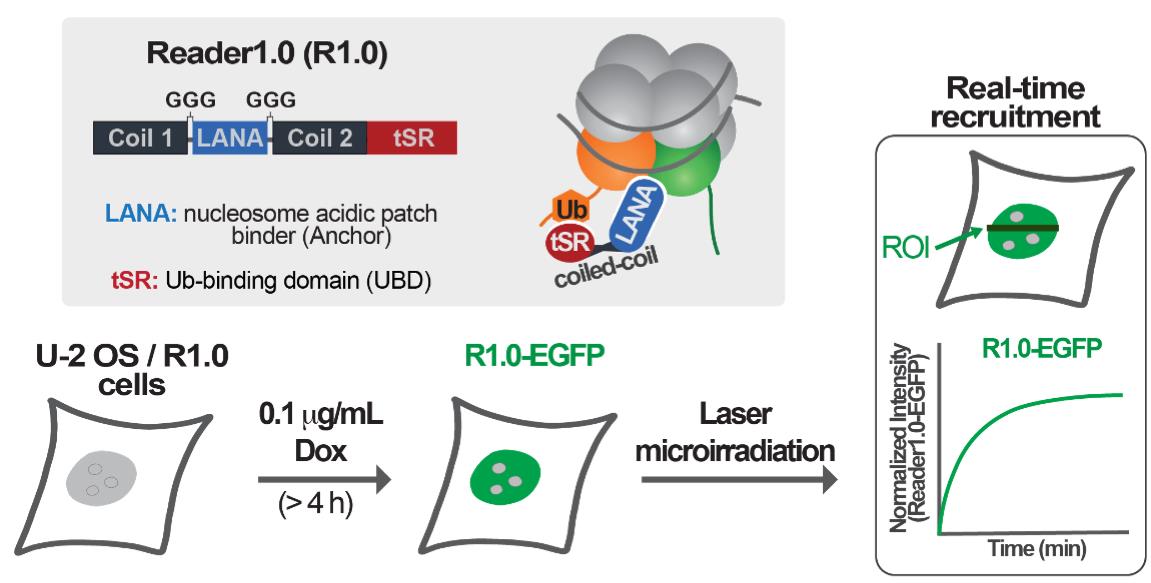
Graphic abstract:
Background
DNA double-strand breaks (DSBs) are a threat to genome integrity and stability. DSBs can be generated in response to external agents (e.g., irradiation, radiomimetic chemicals) or formed as byproducts of normal cell metabolism (e.g., oxidative stress, DNA replication errors). To deal with DSBs, eukaryotic cells use complex repair machinery equipped with protein effectors responsible for detecting, signaling, and promoting the repair of these lesions. Defects in DNA DSB repair can lead to mutations or chromosomal aberrations and, ultimately, contribute to the onset of cancer and neurodegenerative diseases (Jackson and Bartek, 2009; Ciccia and Elledge, 2010; Polo and Jackson, 2011).
In response to DNA DSBs, the serine/threonine kinase ataxia-telangiectasia mutated (ATM) is activated and promotes the phosphorylation of various proteins in chromatin surrounding the damage sites. These phosphorylation substrates include histone variant H2AX in vertebrates. Phosphorylated H2AX (γH2AX) leads to the sequential recruitment of mediator of DNA damage checkpoint protein 1 (MDC1) and the E3 ubiquitin ligases RNF8 and RNF168. RNF168 specifically ubiquitinates lysines 13 or 15 at the N-terminal tail of histone H2A (H2AK13/15Ub) (Mattiroli et al., 2012), which in turn can recruit effectors of non-homologous end joining (NHEJ) or homologous recombination (HR)-mediated repair (Mattiroli and Penengo, 2021). The NHEJ repair factor 53BP1 is recruited by nucleosomes containing both H4K20me2 and H2AK15Ub (Fradet-Turcotte et al., 2013; Wilson et al., 2016; Hu et al., 2017). In contrast, the BRCA1/BARD1 complex promotes the HR pathway and is recruited by nucleosomes modified with H2AK13Ub or H2AK15Ub, only if H4K20 is not methylated (H4K20Me0) (Becker et al., 2021; Hu et al., 2021). The minimal focus-forming region (FFR) of 53BP1 has been previously shown to localize to DSBs induced by gamma or laser irradiation, and thereby report local increases in H2AK15Ub at DNA lesions (Fradet-Turcotte et al., 2013; dos Santos Passos et al., 2021). However, structural and biochemical studies have demonstrated that 53BP1 binding to the nucleosomes requires both H2AK15Ub and H4K20Me2 modifications. The H4K20Me2 modifications are enriched in the G1 and early S-phases of the cell cycle (Fradet-Turcotte et al., 2013; Wilson et al., 2016; Hu et al., 2017; Michelena et al., 2021).
In recent work, we developed and validated an avidity-based sensor to detect H2AK13/15Ub-nucleosomes. This sensor, which we call Reader1.0, can bind nucleosomes containing either H2AK13Ub or H2AK15Ub in vitro, and it localizes to sites of RNF168-mediated ubiquitination in mammalian cells. In addition, Reader1.0 binding to H2AK13/15Ub-nucleosomes does not depend on the methylation status of histone H4K20; i.e., Reader1.0 recognizes H2AK13/15Ub-nucleosomes containing either H4K20me0 or H4K20me2. When fused to fluorescent proteins and expressed at tightly-controlled levels, Reader1.0 can be used to monitor the dynamics of H2AK13/15Ub in live cells over long time intervals without causing significant perturbation of cell growth rate or DNA repair kinetics (dos Santos Passos et al., 2021).
The protocol presented here describes how to measure the recruitment of readers of RNF168-dependent H2AK13/15 ubiquitination to DNA DSBs. To rapidly generate local high concentrations of H2AK13/15Ub, laser microirradiation was used to induce DNA damage in the nuclei of U-2 OS cells. The main advantages of this method are the abilities to target defined nuclear volumes and to generate similar amounts of DNA damage in different nuclei within a cell population (Bekker-Jensen et al., 2006; Lukas et al., 2003). By co-expressing mCherry-53BP1-FFR and Reader1.0-EGFP, we demonstrated that our designed sensor Reader1.0 and 53BP1-FFR both redistribute to laser-induced DNA lesions with similar kinetics. In sum, this protocol describes the detection of H2AK13/15Ub at DNA DSBs in live cells by fluorescence confocal microscopy.
Materials and Reagents
60 mm tissue culture dishes (Genesse Scientific, catalog number: 26-260)
35-mm glass-bottom dishes (MatTek, catalog number: P35G-1.5-14-C)
Phosphate buffered saline (PBS; Corning, catalog number: 21-040-CV)
TrypLETM express enzyme (Gibco, catalog number: 12604021)
Dulbecco's modified Eagle's medium (DMEM; Corning, catalog number: 15-013-CV)
FluoroBriteTM DMEM (Gibco, catalog number: A1896701)
Opti-MEMTM reduced serum medium (Gibco, catalog number: 11058021)
Penicillin-Streptomycin 100× solution (10,000 U/mL; HyClone, catalog number: SV30010)
L-Glutamine 200 mM solution (HyClone, catalog number: SH30034.01)
Fetal bovine serum (FBS; Sigma-Aldrich, catalog number: F0926)
LipofectamineTM 3000 transfection reagent (ThermoFisher, catalog number: L3000015)
Dimethyl sulfoxide (DMSO, Fisher Scientific, catalog number: BP231-100)
Doxycycline (Dox) hydrochloride (Fisher Scientific, catalog number: BP2653-1)
U-2 OS cells stably expressing Reader1.0-EGFP under the control of a Dox-inducible promoter (dos Santos Passos et al., 2021)
Plasmid mCherry-BP1-2 pLPC-Puro (Addgene, plasmid number: 12259)
Growth medium (see Recipes)
Live-cell medium (see Recipes)
Equipment
CO2 incubator (Thermo Fisher Scientific, model: Heracell VIOS 160i)
Bead bath 37°C incubator (Lab Armor, model: 74300-706)
Vortex mixer (Fisher Scientific, model: Genie 2, catalog number: 12-812)
Confocal laser scanning microscope (Carl-Zeiss, model: LSM 880) operated with Zen Black 2.3 software (v.14.0.9.201) and equipped with a Plan-Apochromat 63×/1.40 oil-immersion objective
Stage Incubator for Live-Cell Imaging (PECON, PM 2000 RBT)
Software
Zen Black 2.3 software (v.14.0.9.201; Carl-Zeiss)
Zen Blue 2.3 software (v.2.3.69.1000; Carl-Zeiss)
Procedure
Cell preparation
For this protocol, we used U-2 OS cells stably expressing the H2AK13/15Ub sensor Reader1.0-EGFP under the control of a doxycycline (Dox)-inducible promoter (dos Santos Passos et al., 2021). Stable cell lines and plasmids encoding Reader1.0-EGFP for transient or stable expression in mammalian cells are available from the corresponding author (T.Y.; tingting.yao@colostate.edu) and will be deposited with Addgene.org.
Procedure for 35 mm glass bottom dish:
Day 1 – Seed cells for transfection:
Seed 3 × 10⁵ cells per dish in 2 mL of growth medium to obtain approximately 70% confluency the next day.
Incubate for 16-24 h at 37°C in a 5% CO2 incubator.
Day 2 – Transfect cells with mCherry-BP1-2 pLPC-Puro (mCherry-53BP1-FFR):
Prepare the DNA-Lipofectamine 3000 complex as follows: dilute 0.5 µg plasmid DNA in 125 µL of Opti-MEM I, then add 1 µL of P3000 reagent B and mix well (Tube A). In a separate tube, add 1 µL of Lipofectamine 3000 reagent A in 125 µL of Opti-MEM I and mix well (Tube B). Add the diluted DNA from Tube A to the diluted Lipofectamine 3000 reagent in Tube B, mix gently, and incubate at room temperature for 15 min.
Add DNA-Lipofectamine 3000 complex to cells in a dropwise fashion.
Incubate for 16–20 h at 37°C in a 5% CO2 incubator.
Day 3 – Induce Reader1.0-EGFP expression with 0.1 µg/mL Dox:
Aspirate to remove the medium and rinse with 2 mL of PBS.
Add 2 mL of live-cell medium supplemented with 0.1 µg/mL Dox.
Incubate for 4 h at 37°C in a 5% CO2 incubator.
Perform laser microirradiation and real-time recruitment as in ‘B’.
Laser microirradation and real-time recruitment
Note 1: Experiments require a confocal laser scanning microscope equipped with 405, 488, and 561 laser lines for fluorescence excitation and a stage incubator to maintain 37°C and a humidified 5% CO2 atmosphere. The experiments described here were conducted using a Zeiss LSM 880 inverted microscope.
Note 2: Previous experience with confocal laser scanning microscopy is required to execute this protocol.
Note 3: The LSM 880 microscope is a laser hazard class 3B instrument. Users must take care to not expose themselves to the radiation and, in particular, never look into the laser beam. Only personnel instructed on laser safety should be allowed to operate the system.
Turn on the microscope and set the temperature of the stage incubator to 37°C and the CO2 concentration to 5%.
Wait for the temperature and CO2 concentration to stabilize (approximately 15 min) and then transfer the 35 mm glass-bottom culture dish to the stage incubator of the microscope.
Acquire pre-microirradiation images of cells co-expressing mCherry-53BP1-FFR and Reader1.0-EGFP according to the parameters below and save the images as .czi files:
mCherry-53BP1-FFR was excited at 561 nm and the fluorescence emission was collected using the 488/543/633 main dichroic beam splitter (MBS) and the Gallium Arsenide Phosphide (GaAsP) photomultiplier (PMT) detector (Figure 1).
Reader1.0-EGFP was excited at 488 nm and the fluorescence emission was collected using the 488/543/633 MBS and the GaAsP PMT detector (Figure 2).
Note: The 405 MBS for invisible light should be selected considering that the 405 nm diode laser will be used to microirradiate the cells to generate local DNA damage.
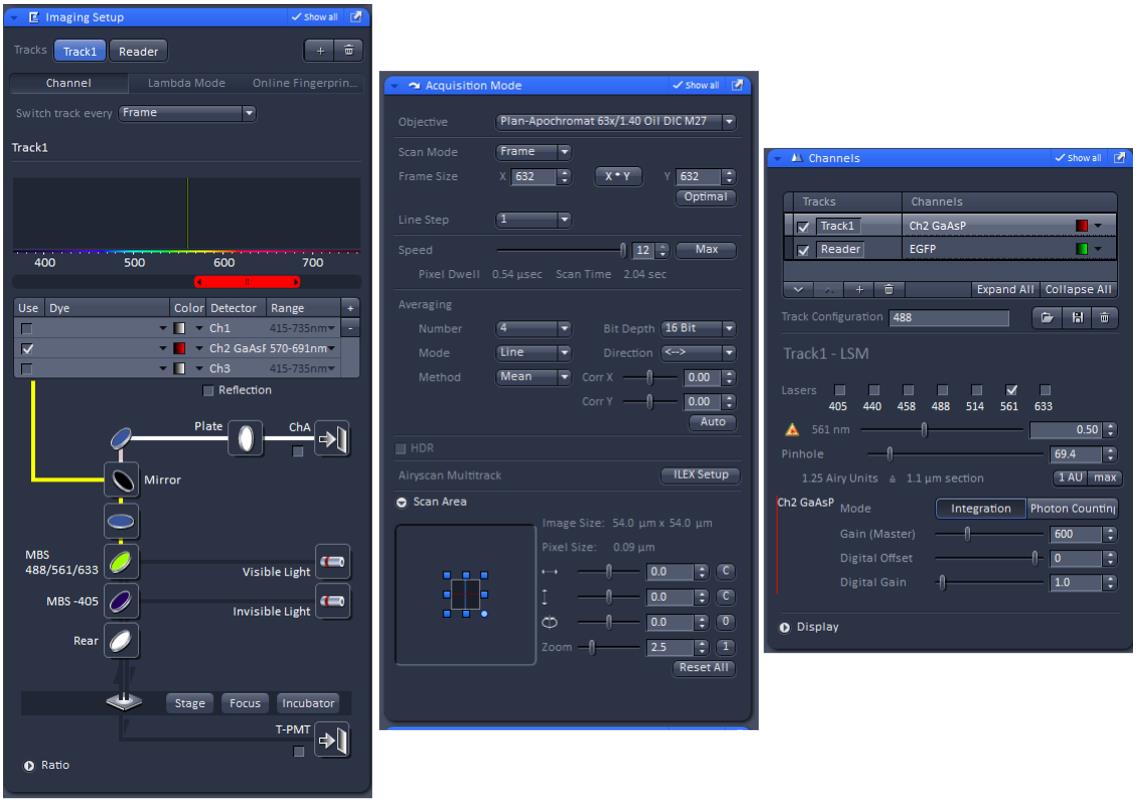
Figure 1. Zen Black software setting for mCherry-53BP1-FFR imaging.Note: The ‘Imaging Setup’, ‘Acquisition Mode’, and ‘Channels’ tabs will automatically open when Zen Black is started.
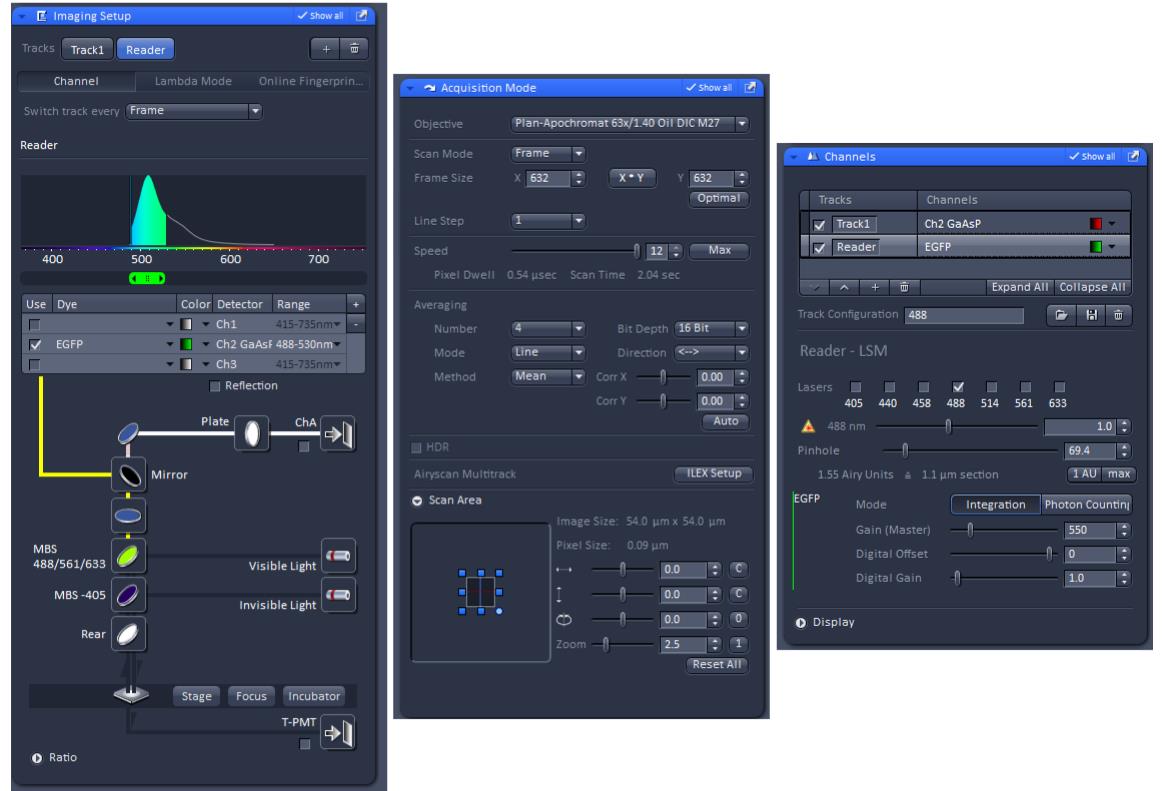
Figure 2. Zen Black software setting for Reader1.0-EGFP imaging.
Configure the microscope for the microirradiation experiment:
In the ‘Acquisition’ tab, check the boxes ‘Time Series’, ‘Bleaching’, and ‘Regions’ (Figure 3A).
Expand the ‘Bleaching’ tool tab and set up the conditions for laser microirradiation according to Figure 3B.
Note: It may be necessary to test different laser intensities in ‘Excitation of Bleach’ in order to efficiently induce DNA damage.
Expand the ‘Time Series’ tool tab and define the number ‘Cycles’ (number of frames to be acquired) and the time ‘Interval’ between cycles (Figure 3C).
Expand the ‘Regions’ tool tab to define the Region of Interest (ROI) in the nucleus that will be microirradiated with the 405 nm laser (Figure 3D).
Note: In this example, the ROI for laser microirradiation was a rectangle 300 × 5 pixels (L × W). Considering that the scanner is configured to move along the y-axis, to generate a uniform amount of damage, only the width (W = 5 pixels) of the irradiated ROI needs to be kept constant. The length (L) of the rectangle may be adjusted within the confines of the area of the nucleus.
After verifying the settings, go to the ‘Acquisition’ tab and hit the ‘Start Experiment’ button (Figure 3A).
Note: Make sure to select both the 488 nm and the 561 nm tracks for image acquisition.
The real-time recruitment of mCherry-53BP1-FFR and Reader1.0-EGFP to the irradiated tracks can be monitored in the ‘Mean ROI’ view tab in Zen Black (Figure 4).
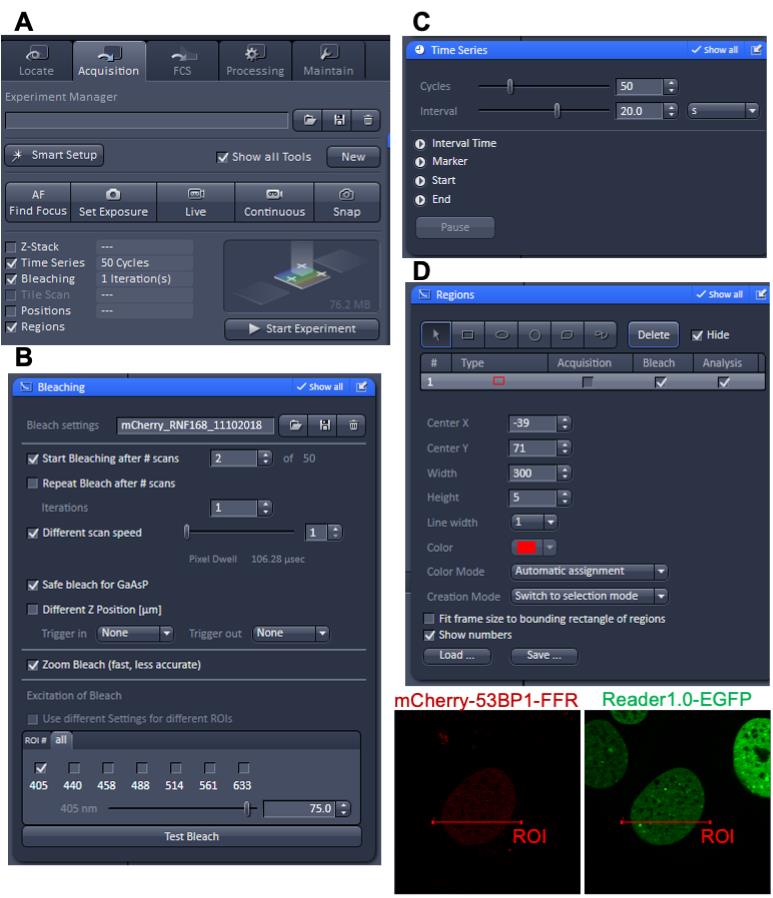
Figure 3. Zen Black software settings for laser microirradiation and real-time recruitment. (A) ‘Acquisition’ tab. (B) ‘Bleaching’ tool tab. (C) ‘Time Series’ tool tab. (D) ‘Regions’ tool tab and example depicting the Region of Interest (ROI) that will be microirradiated.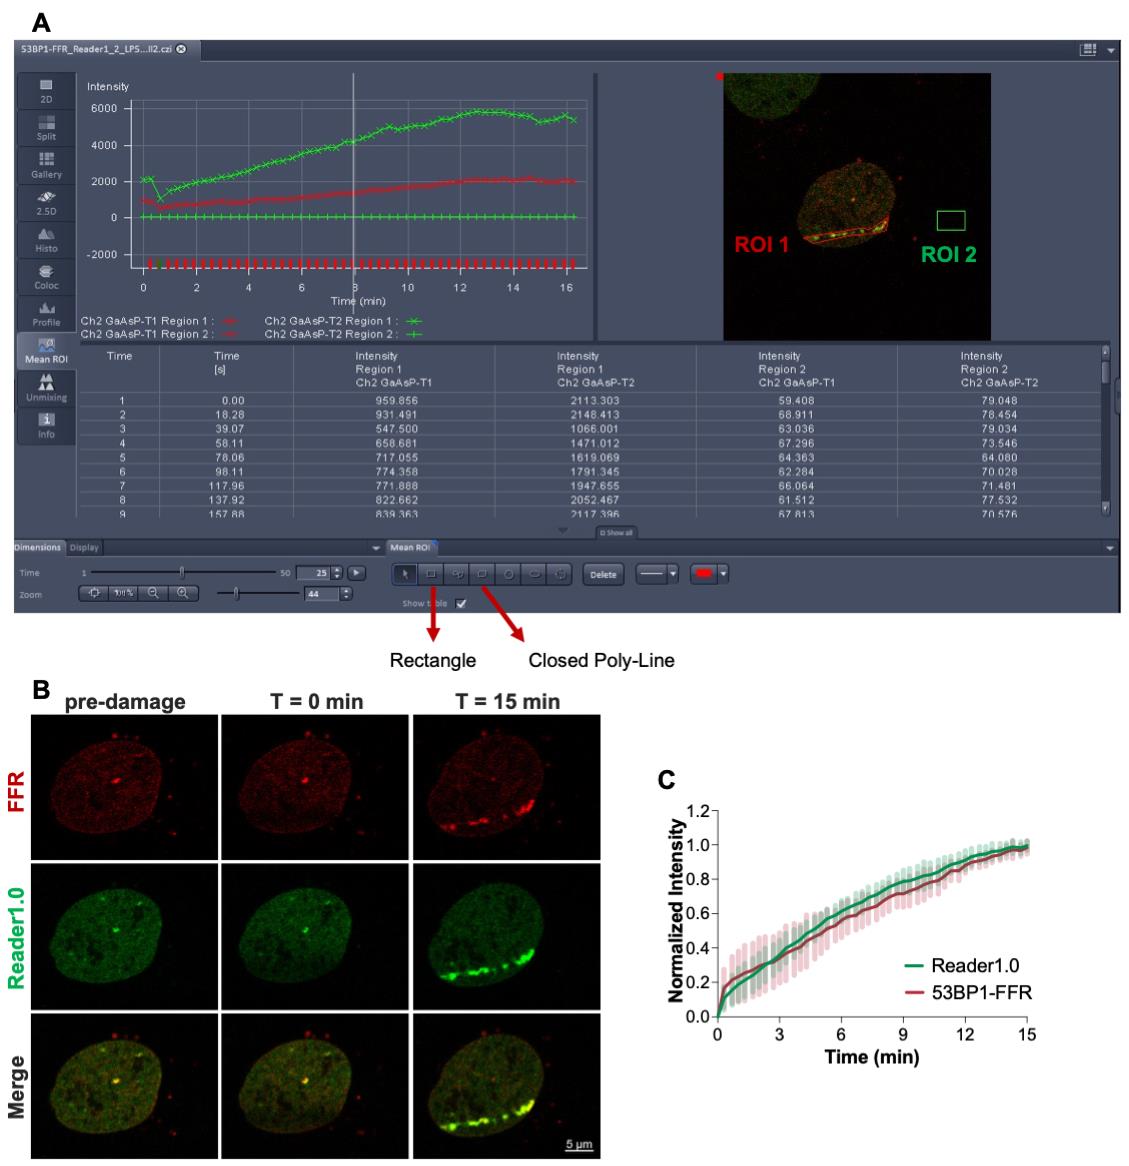
Figure 4. Laser microirradiation and real-time recruitment of mCherry-53BP1-FFR and Reader1.0-EGFP to DSBs. (A) U-2 OS cells co-expressing mCherry-53BP1-FFR and Reader1.0-EGFP were microirradiated using the 405 nm laser and fluorescence redistribution to the laser-induced DSBs were extracted from background-corrected individual frames (ROI 1: DSB track; ROI 2: background). (B) Representative images of the irradiated cell at the indicated time points. (C) Reader1.0-eGFP and mCherry-53BP1-FFR showed similar rates of recruitment to DNA lesions (n = 12).
Data analysis
Recruitment analysis
Note: Figure 4A shows an example of raw data acquired for one cell and opened in the ‘Mean ROI’ view tab of Zen Black. Figure 4B shows representative images of the cell shown in 4A at selected times: Pre-irradiation, T = 0 min (time zero after irradiation) and T = 15 min (15 min after irradiation). These images were extracted and processed using the Zen Blue software. Figure 4C shows the processed data plotted using Excel.
Open the .czi files in Zen Black and go to the ‘Mean ROI’ view tab.
Go to the frame #25 and define a Region of Interest (ROI 1) encompassing the micro-irradiated track where the accumulation of mCherry-53BP1-FFR (561 nm track) and Reader1.0-EGFP (488 nm track) is visible (Figure 4A).
Draw a rectangle outside the nucleus (ROI 2) for background subtraction (Figure 4A).
Notes:
The ‘Mean ROI’ view tab in the Zen Black software allows the operator to define ROIs with different shapes. In the example shown in Figure 4A, ROI 1 was drawn using the ‘Closed Poly-Line’ option and ROI 2 using the ‘Rectangle’ option.
Considering that cells can move over the time of image acquisition, the region of interest (ROI 1) for analysis may need to be redefined. Here, ROI 1 was defined as a closed poly-line encompassing the fluorescent protein accumulating at the laser track in frame #25; frame #25 was chosen because it corresponds to a time point (7.3 min after irradiation) in which there is noticeable accumulation of both Reader1.0 and 53BP1-FFR.
Save the data table in .xlsx format.
Note: The data table will contain columns for time interval(s) and mean fluorescence intensities within ROI 1 and ROI 2 for the 561 and 488 nm excitation tracks.
After background subtraction (ROI 1–ROI 2), calculate the local increases in mCherry-53BP1-FFR and Reader1.0-EGFP fluorescence at the laser-induced DNA lesions as follows:
Fold Increase = It/Ipre, where It denotes the fluorescence intensity at the damaged region at time t, and Ipre denotes the fluorescence intensity before microirradiation (dos Santos Passos et al., 2021).
Normalized intensity = (It – Ipre)/(Ilast – Ipre), where It denotes the fluorescence intensity at the damaged region at time t, Ipre denotes the fluorescence intensity before microirradiation, and Ilast denotes the fluorescence intensity at the lesion in the last time point (Figure 4C).
Note 1: Typically, N ≥ 6 cells should be analyzed per tested condition. If the goal of the experiment is to compare different experimental groups (e.g., transfections with siRNAs to deplete DNA repair effectors), the number of cells analyzed should be sufficient to detect significant differences when they exist. In this case, the sample size should be determined taking into account the standard deviations of the measurements and the amplitudes of the differences (i.e., differences between control and tested conditions).
Note 2: When we analyzed U-2 OS cells stably expressing Reader1.0 and transfected with siCtrl or siRNF168, we determined that N = 6 cells was sufficient to detect differences in Reader1.0 recruitment to DSBs in cells depleted of RNF168 (dos Santos Passos et al., 2021).
Note 3: Reader1.0 competes with endogenous DNA repair machinery (53BP1 or BARD1) for binding to RNF168-mediated ubiquitinated nucleosomes. High Reader1.0 expression inhibits the recruitment of 53BP1-FFR to laser-induced DSBs (dos Santos Passos et al., 2021). This observation highlights the importance of expressing the sensor at low but detectable levels. In this protocol, stable expression of Reader1.0 under the control of a Dox-inducible promoter allows sensor levels that can effectively report H2AK13/15Ub under the tested conditions without causing perturbation to DNA repair.
By performing competition experiments between Reader1.0 and 53BP1-FFR, we determined that optimal expression levels of Reader1.0 can be achieved by treating U-2 OS/Reader1.0-EGFP cells with 0.1 µg/mL Dox for 4–12 h before live-cell imaging or, alternatively, with 0.01 µg/mL Dox for 24–48 h before imaging. An alternative approach is to do transient transfection to express Reader1.0; here, the subset of cells expressing Reader1.0 at low levels can be identified microscopically and used for experiments.
The dynamics of sensor binding to DNA damage sites can be determined by Fluorescence Recovery After Photobleaching (FRAP) measurements. Titrating the levels of Reader1.0 expression can be used to deconvolute FRAP half-lives (FRAP t1/2) into kinetic parameters (kon and koff). For quantitative analysis of FRAP experiments, we recommend readers to refer to the review by McNally (2008).
Recipes
Growth medium
(DMEM supplemented with 10% FBS, 1% Penicillin-Streptomycin, and 2 mM L-Glutamine)
440 mL of DMEM
50 mL of FBS
5 mL of 100× Penicillin-Streptomycin solution
5 mL of L-Glutamine 200 mM solution
Live-cell medium
(FluorBriteTM DMEM supplemented with 10% FBS, 1% Penicillin-Streptomycin, and 2 mM L-Glutamine)
44 mL of FluorBriteTM DMEM
5 mL of FBS
0.5 mL of 100× Penicillin-Streptomycin solution
0.5 mL of L-Glutamine 200 mM solution
Note: Growth medium and Live-Cell medium should be stored at 4°C and warmed up to 37°C before use. For storage time, see manufacturer’s instructions.
1 mg/mL Dox solution
1 mg Doxycycline hydrochloride
1 mL of DMSO
Note: 1 mg/mL Dox solution should be separated into 1 mL aliquots and stored at -20°C for up to 12 months.
Acknowledgments
This research was supported by National Institutes of Health grants R21ES029150 to R.E. Cohen and T. Yao, R01GM115997 to R.E. Cohen, and R01GM098401 to T. Yao. This protocol describes methodology used in the research paper (DOI: 10.1083/jcb.201911130) by dos Santos Passos et al. (2021).
Competing interests
The authors declare no competing financial interests.
References
- Becker, J. R., Clifford, G., Bonnet, C., Groth, A., Wilson, M. D. and Chapman, J. R. (2021). BARD1 reads H2A lysine 15 ubiquitination to direct homologous recombination. Nature 596: 433-437.
- Bekker-Jensen, S., Lukas, C., Kitagawa, R., Melander, F., Kastan, M. B., Bartek, J. and Lukas, J. (2006). Spatial organization of the mammalian genome surveillance machinery in response to DNA strand breaks. J Cell Biol 173: 195-206.
- dos Santos Passos, C., Choi, Y.-S., Snow, C. D., Yao, T., Cohen, R. E. (2021). Design of genetically encoded sensors to detect nucleosome ubiquitination in live cells. J Cell Biol 220: e201911130.
- Ciccia, A. and Elledge, S. J. (2010). The DNA damage response: making it safe to play with knives. Mol Cell 40: 179-204.
- Fradet-Turcotte, A., Canny, M. D., Escribano-Diaz, C., Orthwein, A., Leung, C. C., Huang, H., Landry, M. C., Kitevski-LeBlanc, J., Noordermeer, S. M., Sicheri, F. and Durocher, D. (2013). 53BP1 is a reader of the DNA-damage-induced H2A Lys 15 ubiquitin mark. Nature 499: 50-54.
- Hu, Q., Botuyan, M. V., Cui, G., Zhao, D. and Mer, G. (2017). Mechanisms of ubiquitin-nucleosome recognition and regulation of 53BP1 chromatin recruitment by RNF168/169 and RAD. Mol Cell 66: 473-487.
- Hu, Q., Botuyan, M. V., Zhao, D., Cui, G., Mer, E. and Mer, G. (2021). Mechanisms of BRCA1-BARD1 nucleosome recognition and ubiquitylation. Nature 596: 438-443.
- Jackson, S. P. and Bartek, J. (2009). The DNA-damage response in human biology and disease. Nature 461: 1071-1078.
- Lukas, C., Falck, J., Bartkova, J., Bartek, J. and Lukas, J. (2003). Distinct spatiotemporal dynamics of mammalian checkpoint regulators induced by DNA damage. Nat Cell Biol 5: 255-260.
- Mattiroli, F. and Penengo, L. (2021). Histone ubiquitination: an integrative signaling platform in genome stability. Trends Genet 37: 566-581.
- Mattiroli, F., Vissers, J. H., van Dijk, W. J., Ikpa, P., Citterio, E., Vermeulen, W., Marteijn, J. A. and Sixma, T. K. (2012). RNF168 ubiquitinates K13-15 on H2A/H2AX to drive DNA damage signaling. Cell 150: 1182-1195.
- McNally, J. G., (2008). Quantitative FRAP in analysis of molecular binding dynamics in vivo. Methods Cell Biol 85: 329-51.
- Michelena, J., Pellegrino, S., Spegg, V. and Altmeyer, M. (2021). Replicated chromatin curtails 53BP1 recruitment in BRCA1-proficient and BRCA1-deficient cells. Life Sci Alliance 4: e202101023.
- Polo, S. E. and Jackson, S. P. (2011). Dynamics of DNA damage response proteins at DNA breaks: a focus on protein modifications. Genes Dev 25: 409-433.
- Wilson, M. D., Benlekbir, S., Fradet-Turcotte, A., Sherker, A., Julien, J. P., McEwan, A., Noordermeer, S. M., Sicheri, F., Rubinstein, J. L. and Durocher, D. (2016). The structural basis of modified nucleosome recognition by 53BP. Nature 536: 100-103.
Article Information
Publication history
Accepted: Jan 12, 2022
Published: Mar 5, 2022
Copyright
© 2022 The Authors; exclusive licensee Bio-protocol LLC.
How to cite
Readers should cite both the Bio-protocol article and the original research article where this protocol was used:
- dos Santos Passos, C., Cohen, R. E. and Yao, T. (2022). Laser Microirradiation and Real-time Recruitment Assays Using an Engineered Biosensor. Bio-protocol 12(5): e4337. DOI: 10.21769/BioProtoc.4337.
- dos Santos Passos, C., Choi, Y.-S., Snow, C. D., Yao, T., Cohen, R. E. (2021). Design of genetically encoded sensors to detect nucleosome ubiquitination in live cells. J Cell Biol 220e201911130.
Category
Biological Engineering > Synthetic biology
Molecular Biology > DNA > DNA damage and repair
Cell Biology > Cell imaging > Live-cell imaging
Do you have any questions about this protocol?
Post your question to gather feedback from the community. We will also invite the authors of this article to respond.
![]() Tips for asking effective questions
Tips for asking effective questions
+ Description
Write a detailed description. Include all information that will help others answer your question including experimental processes, conditions, and relevant images.