
- Submit a Protocol
- Receive Our Alerts
- EN

- Protocols

- Articles and Issues
- For Authors
- About
- Become a Reviewer

Unscheduled DNA Synthesis at Sites of Local UV-induced DNA Damage to Quantify Global Genome Nucleotide Excision Repair Activity in Human Cells
Published: Vol 13, Iss 3, Feb 5, 2023 DOI: 10.21769/BioProtoc.4609 Views: 505
Reviewed by: Alak MannaAnonymous reviewer(s)
Original research article
The authors used this protocol in:
Jun 2021

Protocol Collections
Comprehensive collections of detailed, peer-reviewed protocols focusing on specific topics

Abstract
Nucleotide excision repair (NER) removes a wide variety of structurally unrelated lesions from the genome, including UV-induced photolesions such as 6–4 pyrimidine–pyrimidone photoproducts (6-4PPs) and cyclobutane pyrimidine dimers (CPDs). NER removes lesions by excising a short stretch of single-stranded DNA containing the damaged DNA, leaving a single-stranded gap that is resynthesized in a process called unscheduled DNA synthesis (UDS). Measuring UDS after UV irradiation in non-dividing cells provides a measure of the overall NER activity, of which approximately 90% is carried out by the global genome repair (GGR) sub pathway. Here, we present a protocol for the microscopy-based analysis and quantification of UDS as a measurement for GGR activity. Following local UV-C irradiation, serum-starved human cells are supplemented with the thymidine analogue 5-ethynyl-2'-deoxyuridine (EdU), which is incorporated into repair patches following NER-dependent dual incision. The incorporated nucleotide analogue is coupled to a fluorophore using Click-iT chemistry, followed by immunodetection of CPD photolesions to simultaneously visualize both signals by fluorescence microscopy. Accompanying this protocol is a custom-built ImageJ plug-in to analyze and quantify UDS signals at sites of CPD-marked local damage. The local UDS assay enables an effective and sensitive fluorescence-based quantification of GGR activity in single cells with application in basic research to better understand the regulatory mechanism in NER, as well as in diagnostics to characterize fibroblasts from individuals with NER-deficiency disorder.
Graphical abstract

Background
Cells are continuously exposed to different sources of DNA damage. The nucleotide excision repair (NER) pathway comprises two sub pathways, transcription-coupled repair (TCR) and global genome repair (GGR), which remove helix-distorting lesions including UV-induced photoproducts from genomic DNA. While TCR preferentially removes DNA lesions from the transcribed strand of active genes (van den Heuvel et al., 2021), GGR removes lesions throughout the genome and is the dominant contributor to overall cellular NER activity (Marteijn et al., 2014). Both pathways funnel into a common molecular mechanism involving the same set of core NER proteins that mediate double incision by endonucleases ERCC1-XPF and XPG, resulting in the removal of a 30-nucleotide stretch of single-stranded DNA containing the lesion (van Toorn et al., 2022). After dual incision, the resulting gap is filled by DNA polymerases and sealed by DNA ligases (Ogi et al., 2010). DNA repair–associated DNA synthesis is distinct from synthesis during the S-phase to duplicate the genome, and is therefore referred to as unscheduled DNA synthesis (UDS) (Lehmann and Stevens, 1980). Irradiation with UV-C light generates two main types of genomic lesions: 6–4 pyrimidine–pyrimidone photoproducts (6-4PPs) and cyclobutane pyrimidine dimers (CPDs). The 6-4PPs are repaired considerably faster (within ∼5 h) than the CPDs, which are still present 24 h after UV irradiation (van Hoffen et al., 1995; Luijsterburg et al., 2010; Verbruggen et al., 2014). UDS after UV irradiation can be directly measured via nucleotide incorporation in non-dividing cells and mainly reflects GGR activity, which is responsible for approximately 90% of the overall cellular NER activity (Limsirichaikul et al., 2009). Although radioactive nucleotide analogues were initially used to measure UDS (Cleaver, 1968; Friedberg, 2004), the use of alkyne-linked thymidine analogue 5-ethynyl-2'-deoxyuridine (EdU) is more common nowadays (Limsirichaikul et al., 2009). The incorporated EdU can be visualized by its coupling to a fluorescent azide via Click-iT chemistry (Salic and Mitchison, 2008). Measuring UDS can offer insight in the potential involvement of GGR regulators or assess the functionality of mutated NER proteins, as recently reported for chromatin remodeler ALC1 or the ERCC1R156W variant found in patients with liver and kidney dysfunction, respectively (Blessing et al., 2022;Apelt et al., 2021). In this protocol, we describe a straightforward and accessible method for measuring UDS at sites of local UV irradiation. In brief, cells are exposed to local UV-C irradiation through a micropore filter, causing DNA damage induction and NER-dependent UDS in sub-nuclear regions. The UDS signal at sites of local UV damage can be captured by pulse-labeling with EdU within the first few hours after UV irradiation, followed by fixation and visualization of the incorporated EdU by fluorescent Click-iT chemistry. NER-dependent DNA synthesis mainly reflects rapid 6-4PP repair within the first hours after UV irradiation, during which CPD repair is negligible (van Hoffen et al., 1995; Luijsterburg et al., 2010; Verbruggen et al., 2014). The simultaneous immunodetection of CPD photolesions, which are largely unrepaired within the first hours after UV irradiation, can be used to define sites of local damage. The use of local UV irradiation enables a per-cell correction for unspecific EdU incorporation and accurate exclusion of replicating cells with scheduled EdU incorporation throughout the nucleus. Moreover, we provide a custom-built ImageJ plug-in to quantify UDS signals and apply a correction for potential differences in DNA damage induction between experimental conditions based on the CPD signal. We show that local UDS at sites of UV-induced DNA damage is robustly detected in RPE1-hTERT human cells, while the UDS signal is nearly abolished in an isogenic knockout cell-line for essential NER geneXPG.
Materials and Reagents
12-well cell culture plate (Sigma, catalog number: CLS3512)
18 mm cover glasses, round (VWR, catalog number: 631-1580)
5 µm polycarbonate filters (Millipore, catalog number: TMTP04700)
Parafilm (Sigma, catalog number: P7543)
Microscope slides (VWR, catalog number: 12362098)
DMEM, high glucose, GlutaMAXTM supplement, pyruvate (Gibco, catalog number: 31966-047)
Fetal bovine serum (FBS) (Capricorn Scientific, catalog number: FBS-12A)
5-Ethynyl-2'-deoxyuridine (5-EdU) (Jena Bioscience, catalog number: CLK-N001-100); 50 mM stock in PBS [100 mg in 7.9 mL; to dissolve put in water bath (70°C) for 1 min (until dissolved); aliquot and store at -20°C]
5-Fluoro-2’-deoxyuridine (FuDR) (Sigma, catalog number: F0503); 10 mM stock in MilliQ water (MQ) [100 mg in 40.6 mL; aliquot and store at -20°C]
Thymidine (Sigma, catalog number: T1895); 100 mM stock in MQ [1 g in 41.3 mL; aliquot and store at -20°C]
Formaldehyde 37% (Sigma, catalog number: 252549)
Triton-X100 (Sigma, catalog number: X100)
Bovine serum albumin fraction V (BSA) (Sigma, catalog number: 10735086001)
Tris (Sigma, catalog number: 10708976001)
Atto azide Alexa 647 (Atto Tec, catalog number: 647N-101); 6 mM stock in DMSO [1 mg in 173 µL; aliquot and store at -20°C]
CuSO4 (VWR, catalog number: 23174.233); 40 mM stock in MQ [store at room temperature (RT)]
Ascorbic acid (Sigma, catalog number: A0278); 20 mg/mL stock in MQ [prepare fresh before use]
Glycine (Sigma, catalog number: G7126)
NaOH (Sigma, catalog number: 567530)
Tween20 (Sigma, catalog number: P1379)
CPD antibody (Cosmo Bio, CAC-NM-DND-001)
Goat anti-mouse Alexa 555 (Thermo Fisher Scientific, catalog number: A-21424)
DAPI (Thermo Fisher Scientific, catalog number: D1306)
Aqua poly/mount (Brunschwig, catalog number: 18606)
Sterile PBS (Thermo Fisher Scientific, catalog number: 10010023)
Click reaction mix (see Recipes)
Wash buffer (WB) (see Recipes)
Equipment
Tweezers (stainless steel forceps curved, Sigma, Z168785)
TUV PL-S 9 W UV-C lamp (Philips)
International Light NIST traceable radiometer photometer (Model IL1400BL SEL240/NS254/W)
Fluorescence microscope (Zeiss Axio Imager M2)
Software
Imaging software: Zen (2012 Blue edition)
Data analyses software: ImageJ (version 1.48), with the following requirements:
ImageJ Plugin “bioformats_package.jar” at https://www.openmicroscopy.org/bio-formats/downloads
In-house generated ImageJ macro “GGR-UDS_DataExtraction_ImageJ.txt” available at https://git.lumc.nl/dvandenheuvel/ggr-uds-protocol_lumc_luijsterburglab
In-house generated data quantification file GGR-UDS_analyses_template.xls available at https://git.lumc.nl/dvandenheuvel/ggr-uds-protocol_lumc_luijsterburglab
Procedure
Cell culture (Day 0)
For each condition, seed 100,000 RPE1 cells per well on 18 mm sterile glass coverslips in a 12-well plate in DMEM supplemented with 10% FBS. Let the cells grow to confluency for two days.
Cell culture (Day 2)
Replace the medium with DMEM without FBS to remove the available thymidine and to minimize the number of dividing cells. Incubate for 24 h.
Local UV-C treatment, EdU incorporation, and fixation (Day 3)
Prepare a new 12-well plate with 1 mL of DMEM (without FBS), supplemented with 20 µM EdU and 1 µM FuDR (FuDR inhibits thymidine synthesis and maximizes EdU incorporation).
Wash the cells with PBS.
Rinse the 5 µm polycarbonate filters in PBS.
Cover a tray (e.g., a 15 cm plate) with parafilm and transfer the coverslips (cells facing up) to the parafilm. Make sure different conditions stay separated.
Drain excess PBS from the 5 µm filters and carefully place the filter on top of the coverslips. Duplicates or triplicates can be combined per filter; make sure to not move the filter after placing.
Irradiate the cells through the filter with 30 J/m2.
Note: To prevent drying of the coverslips, irradiate up to three covered sets of coverslips per run and keep the irradiation time as short as possible by reducing the distance to the lamp. Our UV lamp = 0.33 J/m2/s = 91 s for 30 J/m2.
Carefully add PBS on top of the filter to slightly lift it from the coverslips and remove the filter with tweezers.
Drain the excess PBS from the coverslips, place the coverslips in the prepared 12-well plate with 20 µM EdU and 1 µM FuDR, and incubate for 1 h at 37°C.
Note: A longer incubation up to 4 h may be helpful to assess potential residual repair activity in (partially) NER-deficient cells (Apelt et al., 2021).
Wash the cells with DMEM (without FBS) and incubate with DMEM (without FBS) supplemented with 10 µM thymidine for 15 minutes at 37°C, to dilute the non-incorporated EdU.
Wash with PBS and fix the cells in 3.7% formaldehyde (diluted in PBS) for 15 min at RT.
Wash the coverslips twice with PBS and store in PBS at 4°C until click reaction and staining.
Note: Coverslips are stable at 4°C. However, continuation with fluorescent EdU labeling and CPD staining is recommended within approximately one week.
Fluorescent labeling of incorporated EdU by Click-iT chemistry (preferably within one week after fixation in step C)
Remove PBS from the coverslips.
Permeabilize the cells with 0.5% Triton-X100 in PBS for 20 min at RT.
Wash twice for 5 min with 3% BSA in PBS.
Wash once with PBS.
Prepare 100 µL of click reaction mix per coverslip (see Recipes).
Place 100 µL droplets of the click reaction mix on parafilm, place the coverslips (cells facing down) on the droplets, and incubate for 30 min at RT in the dark.
Place the coverslips back in the 12-well plate (cells facing up).
Wash with PBS. Keep the coverslips in the dark during the subsequent steps of the protocol.
Note: Continue immediately with antibody-mediated labeling of remaining CPDs to detect sites of local damage.
Antibody-mediated detection of remaining CPDs
Fix cells again in 2% formaldehyde in PBS for 10 min at RT to prevent any loss of Click-iT signal.
Wash twice with PBS.
Block unreacted aldehydes with 100 mM glycine in PBS for 10 min at RT.
Wash with PBS.
Denature the DNA with 0.5 M NaOH in PBS for 5 min at RT (the CPD antibody only recognizes CPDs in a single-stranded DNA configuration).
Wash three times with PBS.
Block with 10% BSA in PBS for 15 min at RT.
Wash with PBS.
Equilibrate with WB (see Recipes).
Place the coverslips on parafilm (cells facing up), add 100 µL per coverslip of the primary CPD antibody (diluted 1/1,000 in WB), and incubate for 2 h at RT or overnight at 4°C.
Remove the antibody and wash the coverslips while on parafilm four times for 5 min with WB.
Add 100 µL per coverslip of the secondary antibody (goat anti-mouse Alexa 555) diluted 1/1,000 in WB and incubate for 1 h at RT.
Wash once for 5 min in WB.
Add 100 µL per coverslip of DAPI diluted to 1 ug/mL (typically 1/1,000) in WB and incubate for 5 min at RT.
Wash twice for 5 min with PBS.
Mount the coverslips (cells facing down) in aqua poly/mount on glass microscopy slides marked for each condition.
Let dry horizontally overnight at RT.
Image the slides with a fluorescence microscope using 63× magnification and store images in Carl Zeiss Image Data Format (.czi files).
Data analysis
For efficient data extraction from the obtained .czi image files, we developed a custom ImageJ macro that can be combined with downstream data selection in Excel. The related macro-script and Excel template are available on https://git.lumc.nl/dvandenheuvel/ggr-uds-protocol_lumc_luijsterburglab . In brief, ImageJ is used to quantify the signal of the CPD staining and to define nuclei with damaged areas. Subsequently, these nuclei are separated into undamaged and damaged regions of interest (ROIs) and CPD and EdU signals are quantified in both regions. In Excel, cells with similar sizes of damaged areas and levels of CPD signal in their damaged regions are selected to prevent signal bias by large differences in damage induction (Figure 1a, b). Cells undergoing replication, and therefore scheduled DNA synthesis, are excluded from downstream analyses based on the mean EdU signal and its standard deviation in the undamaged region of the nucleus (Figure 1c). Early stages of replication usually start with foci of EdU signal throughout the nucleus, which continues into pan-nuclear EdU signal in later stages of replication. Cells in late-stage replication are excluded based on high EdU signal in undamaged regions of their nuclei. Even though cells in early stages of replication might still have a low mean EdU signal in undamaged regions of their nucleus, the standard deviation of this EdU signal is high, still enabling their exclusion from downstream analyses. After cell selection, for each nucleus, the EdU signal in the damaged region is corrected for its corresponding background signal in the undamaged region. These background-subtracted EdU intensities are subsequently normalized to their corresponding CPD signal and calculated relative to one condition [usually the wild-type (WT) condition] to allow combining multiple experiments. A detailed data extraction and analyses protocol is provided below.
Extracting the CPD and EdU intensities in damaged and undamaged regions of nuclei
CPD and EdU intensities in damaged and undamaged regions of nuclei can be easily extracted using the custom ImageJ macro available at https://git.lumc.nl/dvandenheuvel/ggr-uds-protocol_lumc_luijsterburglab .
Combine all .czi files of an experiment in a separate folder (make sure no other files or folders are present)
Run the custom ImageJ macro “GGR-UDS_DataExtraction_ImageJ.txt” to quantify the CPD signal and define damaged and undamaged regions in the nuclei.
Click Plugins>Macros>Run… and select the location of the macro.
When asked, select the folder where the .czi files are stored.
Open one of the pictures so the macro can extract file details.
In the dialog popping up, fill in the following details:
Total number of channels included per picture.
Number of the channel in which DAPI is detected (usually channel 1).
Number of the channel you want to quantify (CPD channel).
Number of the channel in which you detected the CPD signal for damaged area detection.
Cut-off values for nucleus diameter (values depend on image capture settings; adjust by trial and error).
Preferred minimum size of the damaged area to be included (put to 0 to include all and manually select later).
Select one of the built-in thresholding methods of ImageJ for defining the damaged areas (usually either the “Yen” or “Li” thresholding method from ImageJ works well, but some other options are available; optimize by trial and error).
Select one of the built-in thresholding methods of ImageJ for defining the nuclei (usually either the “Yen” or “Li” thresholding method from ImageJ also works well, but some other options are available; optimize by trial and error).
Click “yes” to analyze all pictures in the folder.
Important: Running the macro in step 2 generates a new data folder at the location of the pictures, containing the results. Move this generated data folder to another location of choice, away from the pictures.
Again, run the custom ImageJ macro “GGR-UDS_DataExtraction_ImageJ.txt,” this time to quantify the EdU signal. Use the same settings as in step 2, except for the channel to measure in step 2.d.iii. Again, move the generated data folder to a location of choice.
The data folders extracted from ImageJ contain three types of output. First, the data folder contains a log file with your submitted macro input. Second, it contains a zip-file per picture with the ROIs of all selected nuclei and damage areas, which can be opened in ImageJ. Third, it contains a results file with quantifications that can be opened in Excel. The quantifications are grouped per damaged nucleus, with data of damaged and undamaged ROIs within the same nucleus in two consecutive rows.
Data selection and normalization
Downstream data selection and normalization can be performed using the Excel template available at https://git.lumc.nl/dvandenheuvel/ggr-uds-protocol_lumc_luijsterburglab . This template contains predefined calculations and graphs and therefore is partially protected from editing. Fill in all the cells in yellow, also detailed below.
Copy to columns C–F the extracted data for the EdU channel.
Copy to column G the extracted data for the CPD channel.
Note: Make sure to have the same row order in both CPD and EdU files, which is automatically correct when the same pictures are analyzed with the exact same settings. The area column for both the CPD and EdU data should be the same and can be used to check the files if needed.
To be able to calculate with the data, give all cells per condition a number in column H.
Note: If you want to regroup data rows in the file, always make sure to keep the consecutive rows of damaged and undamaged ROIs per nuclei together.
To compare duplicates within an experiment, give all cells per duplicate a number in column I.
Fill in the condition numbers and names in columns Y and Z.
Use the basic graphs in the gray frame to include or exclude individual cells (seeFigure 1).
Define minimum and maximum sizes of damage areas in cells AK4 and AL4.
Note: This can be used to exclude very small random CPD speckles or large CPD positive regions that are larger than the pore size of the filter.
Define the maximum intensity and standard deviation that is allowed for undamaged background ROIs in cells AM4 and AN4.
Note: Nonreplicating cells show low EdU intensity and standard deviation in their background ROI; early-stage replicating cells show low EdU intensity but high standard deviation in their background ROI; late-stage replicating cells show high EdU intensity but low standard deviation in their background ROI.
Define the minimum and maximum CPD intensities in damaged ROIs in cells AO4 and AP4.
Note: Select cells with equal CPD intensities throughout the conditions to prevent EdU signal bias by biased damage induction.
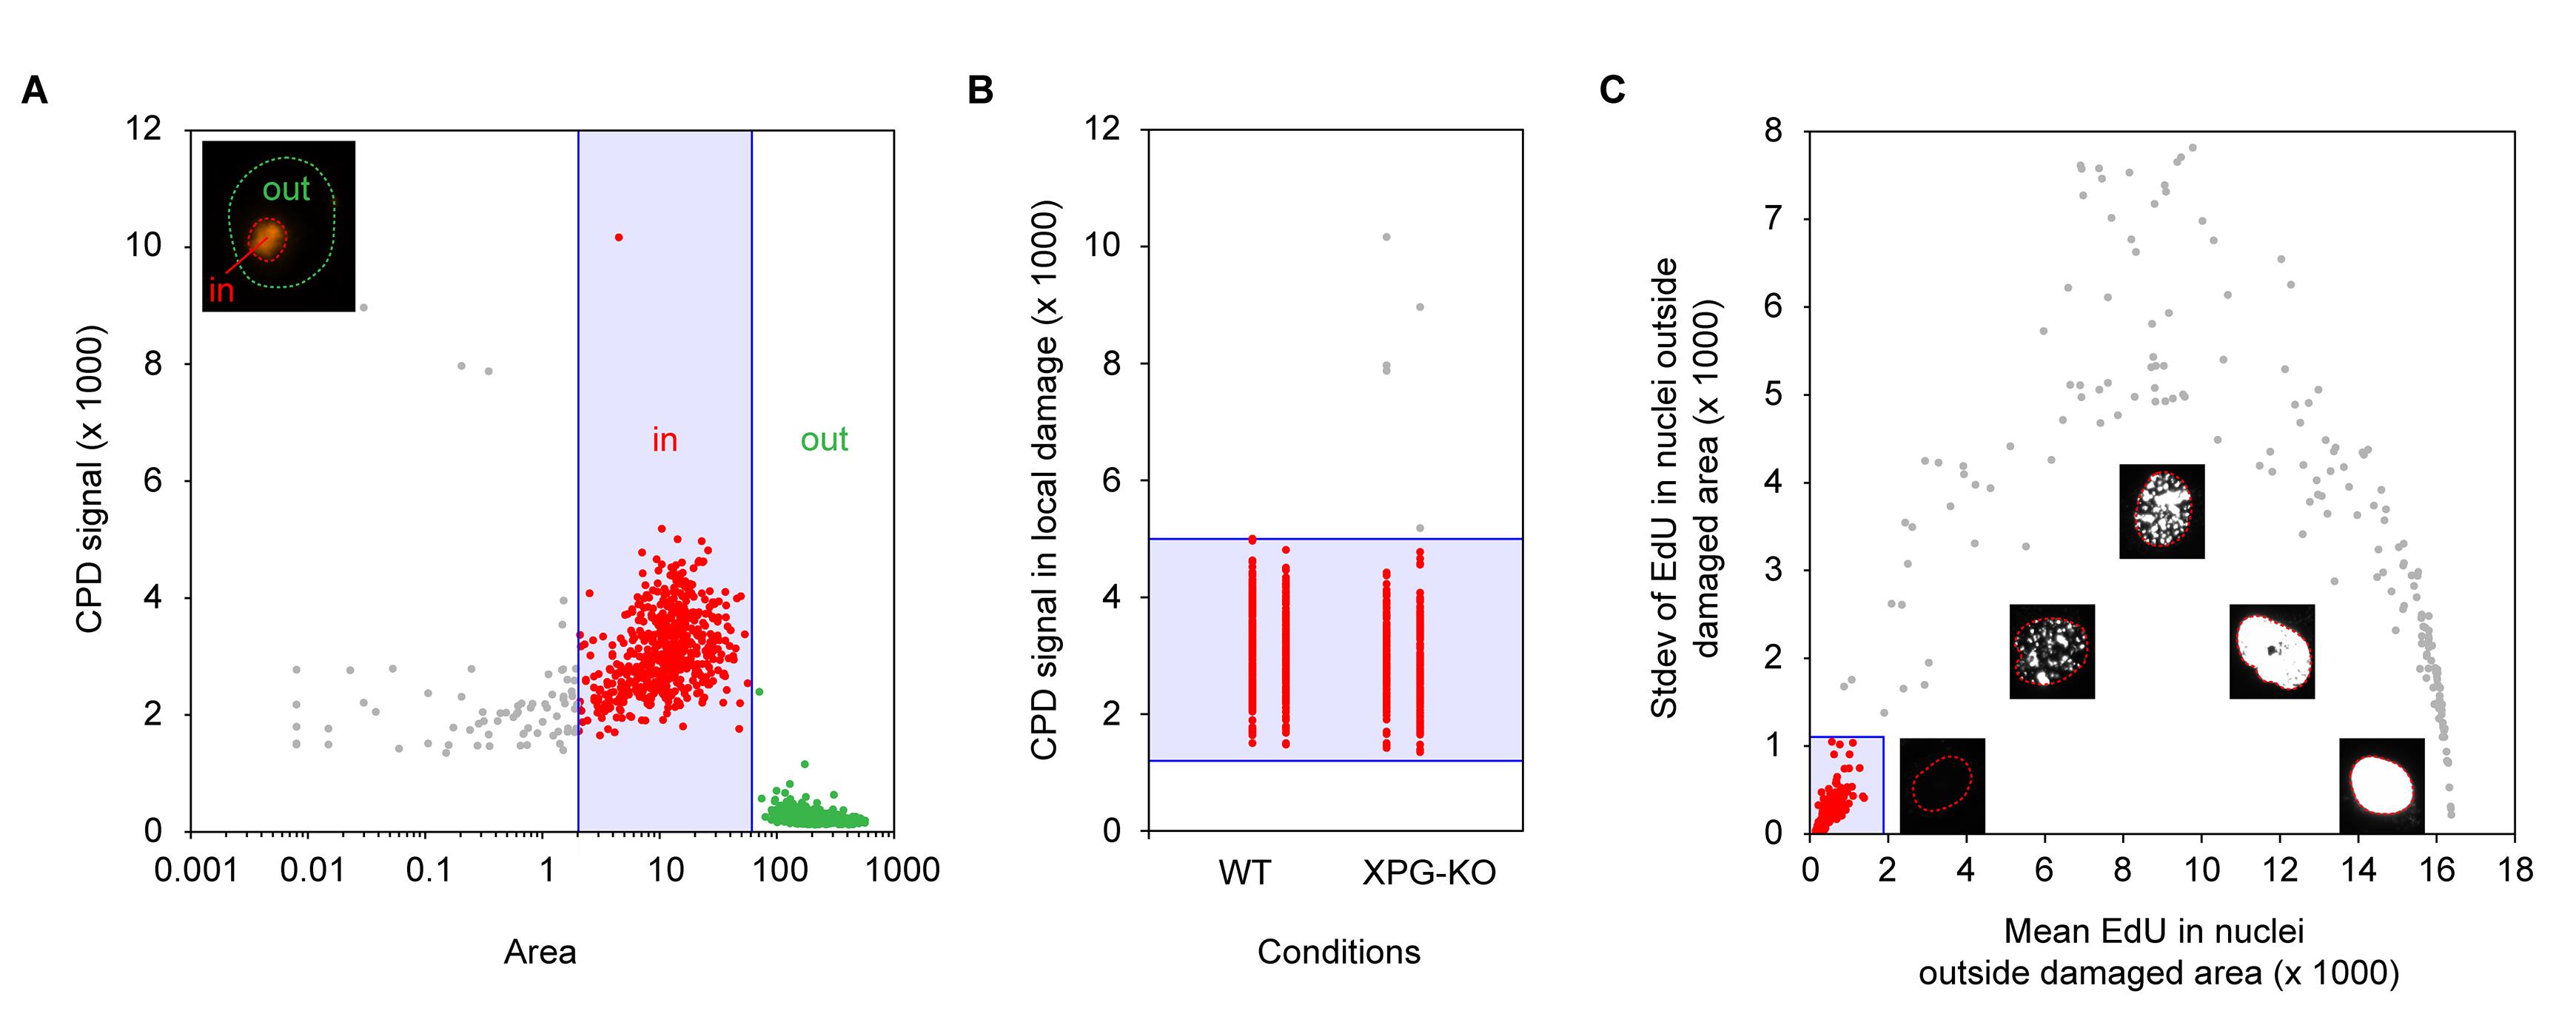
Figure 1. Defining selection criteria for cell inclusion. (a) CPD intensity plotted against area size of both damaged (small area and high CPD signal) and undamaged regions (large area and low CPD signal) of the nuclei, quantified in ImageJ. This plot can be used to define settings for minimum and maximum sizes of damaged regions to include in downstream analyses, indicated in the blue square. (b) CPD intensity in damaged regions separated per condition. This plot can be used to define settings for minimum and maximum CPD intensity in damaged regions to include in downstream analyses, indicated in the blue square. (c) EdU intensity plotted against standard deviation of all undamaged areas. This plot can be used to select nonreplicating cells having low EdU signal and standard deviation in undamaged regions, indicated in the blue square. The inset figures show microscopy examples of EdU signal in cells at different stages of replication.
The Excel file provides the data of background-subtracted and normalized CPD/EdU intensities of individual cells in columns S–V. Overview plots of non-normalized CPD/EdU intensities can be found in the green/orange frames. Overview plots of EdU intensities after normalization to CPD intensity and conditions can be found in the blue frame. To generate violin-dotplot figures from the individual normalized datapoints, we suggest PlotsOfData, a simple freely available online tool (Postma and Goedhart, 2019). As an example of representative results from this protocol, we provide local UDS data of RPE1-hTERT human cells and an isogenic knockout (KO) cell-line for essential NER gene XPG . The parental WT cells show a strong UDS signal at sites of local damage, which is nearly abolished in XPG -KO cells (Figure 2a), as quantified in a violin-dotplot in Figure 2b.
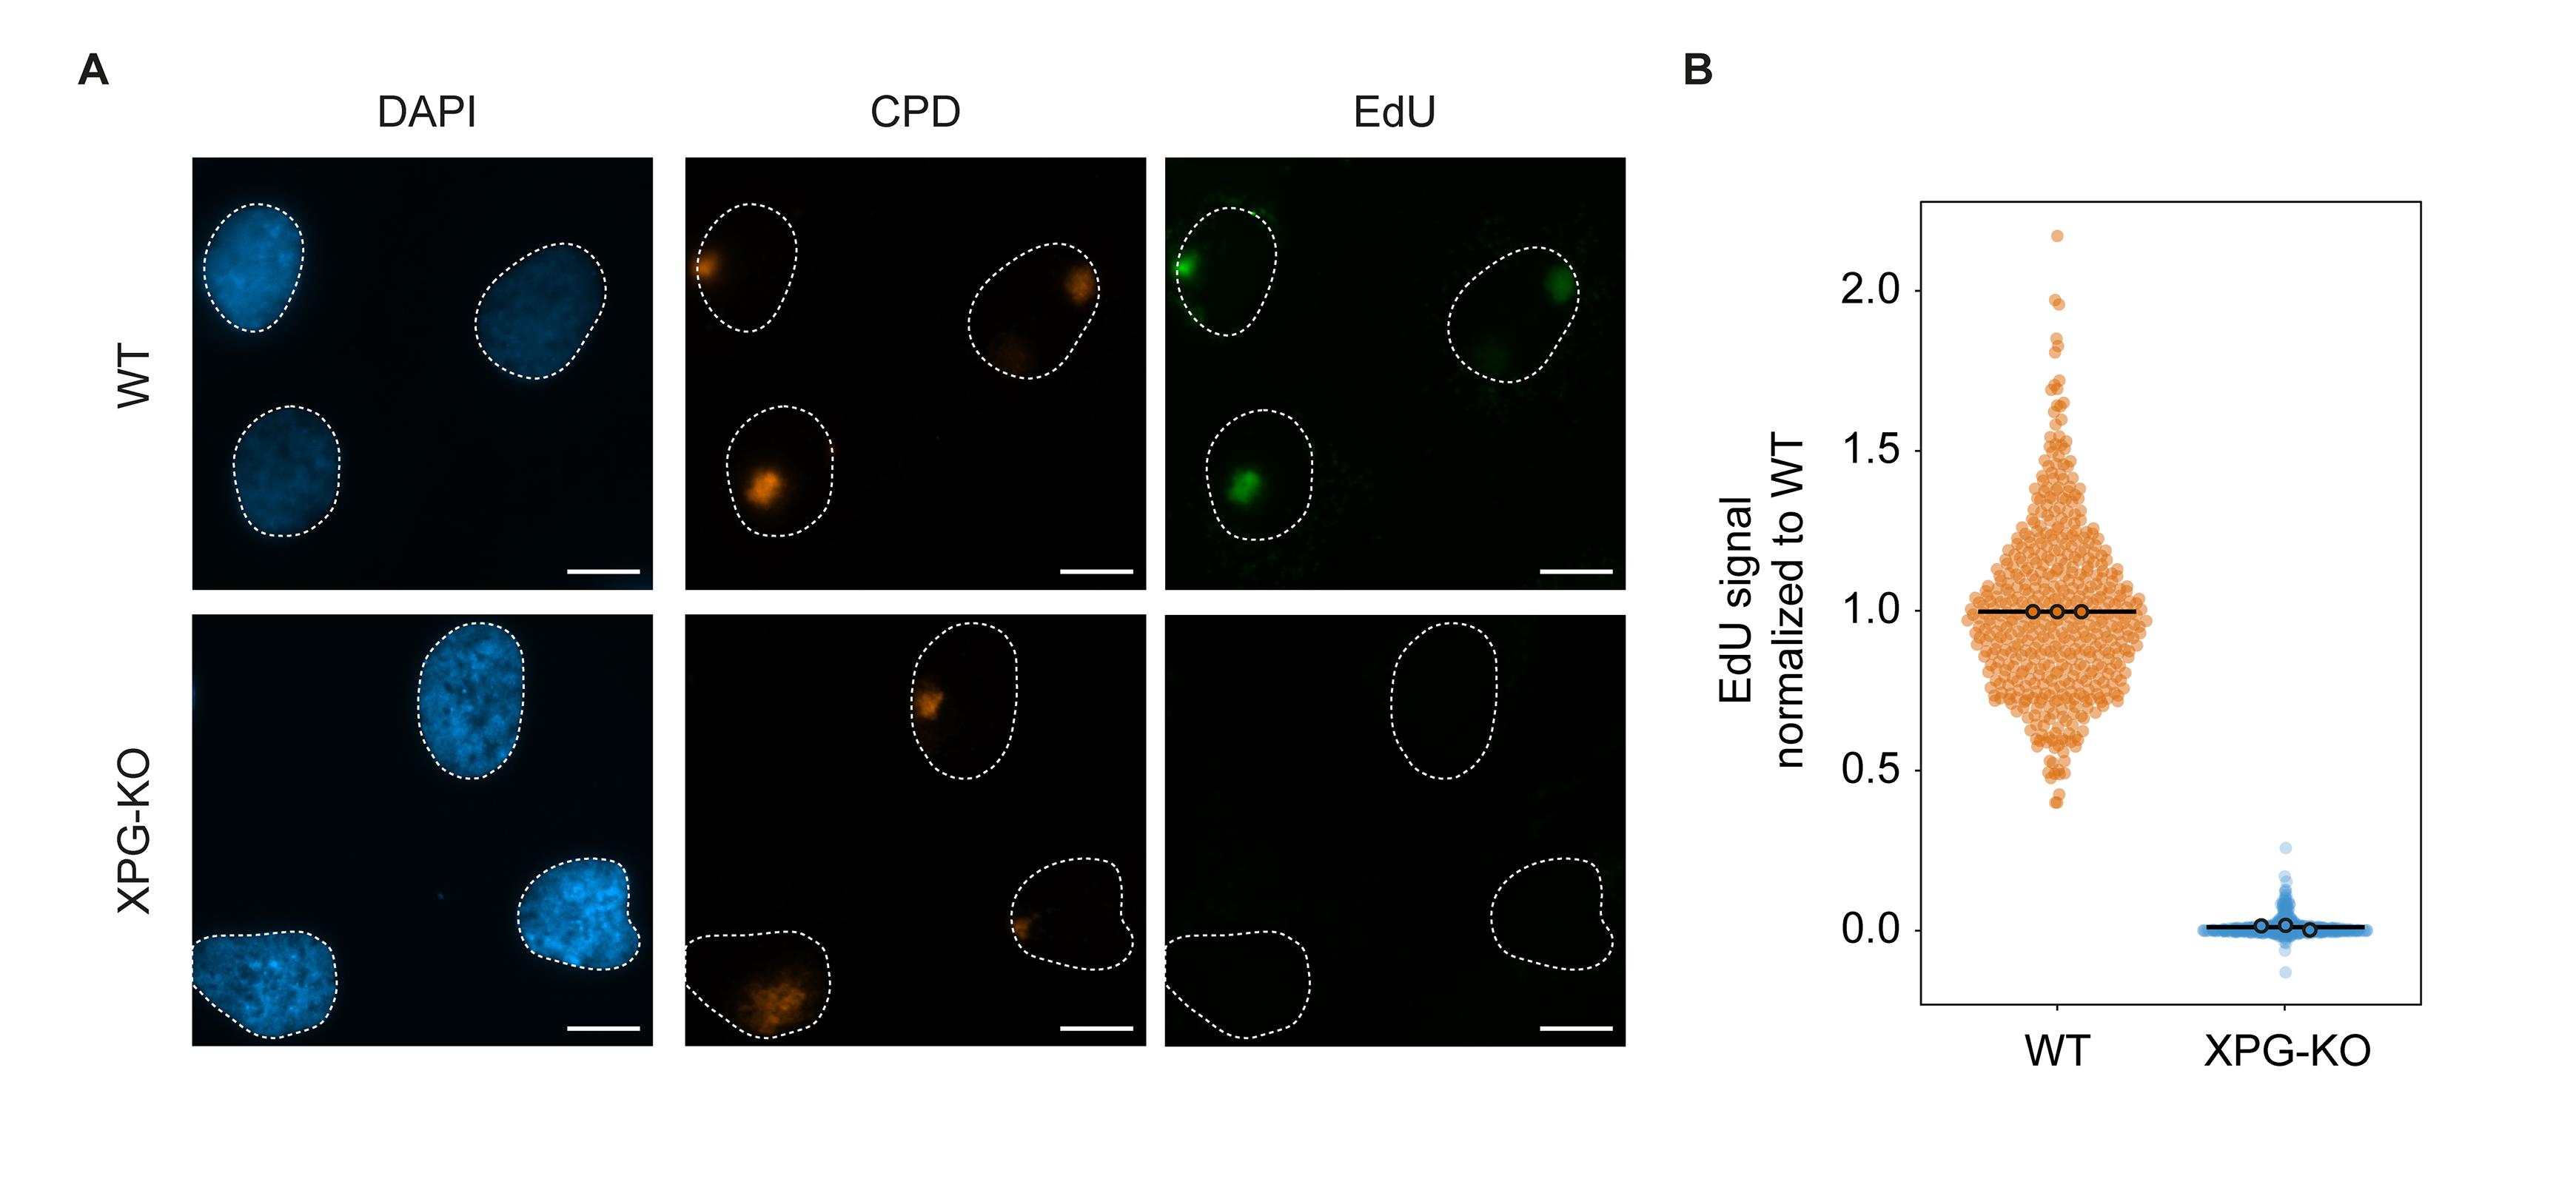
Figure 2. UDS results. (a) Representative immunofluorescence images generated with the unscheduled DNA synthesis protocol in RPE1-hTERT wild-type (WT) or XPG-KO cells. Scalebar represents 10 µm. (b) Quantification of the EdU levels in the damaged areas of the cells. Each datapoint represents the UDS signal from a single cell from three independent replicates. The mean of each biological replicate is depicted as a colored point with black line, while the bar represents the mean of all data points. Plots were generated using plots of data.
Recipes
Click reaction mix (prepare 100 µL per coverslip, within 15 min before use)
Reagent Final concentration Amount Tris (50 mM pH 8) ~50 mM 79 µL Atto azide Alexa 647 (6 mM) 60 µM 1 µL CuSO4 (40 mM) 4 mM 10 µL Ascorbic acid (20 mg/mL)* 2 mg/mL 10 µL Total n/a 100 µL * Prepare stock ascorbic acid fresh before use
Wash buffer (WB) (for 50 mL)
Reagent Final concentration Amount PBS 1× 50 mL BSA 0.5% 0.25 g Tween 20 0.05% 25 μL Total n/a 50 mL
Acknowledgments
This research was supported by an LUMC research fellowship, an ALW-VIDI (ALW.016.161.320) grant from the Dutch Research Council (NWO), and an ERC consolidator grant (101001144) to MSL.
Competing interests
There are no conflicts of interest or competing interests.
References
- Apelt, K., White, S. M., Kim, H. S., Yeo, J. E., Kragten, A., Wondergem, A. P., Rooimans, M. A., Gonzalez-Prieto, R., Wiegant, W. W., Lunke, S., et al. (2021). ERCC1 mutations impede DNA damage repair and cause liver and kidney dysfunction in patients. J Exp Med 218(3).
- Blessing, C., Apelt, K., van den Heuvel, D., Gonzalez-Leal, C., Rother, M. B., van der Woude, M., Gonzalez-Prieto, R., Yifrach, A., Parnas, A., Shah, R. G., et al. (2022). XPC-PARP complexes engage the chromatin remodeler ALC1 to catalyze global genome DNA damage repair. Nat Commun 13(1): 4762.
- Cleaver, J. E. (1968). Defective repair replication of DNA in xeroderma pigmentosum. Nature 218(5142): 652-656.
- Friedberg, E. C. (2004). The discovery that xeroderma pigmentosum (XP) results from defective nucleotide excision repair. DNA Repair (Amst) 3(2): 183, 195.
- Lehmann, A. R. and Stevens, S. (1980). A rapid procedure for measurement of DNA repair in human fibroblasts and for complementation analysis of xeroderma pigmentosum cells. Mutat Res 69(1): 177-190.
- Limsirichaikul, S., Niimi, A., Fawcett, H., Lehmann, A., Yamashita, S. and Ogi, T. (2009). A rapid non-radioactive technique for measurement of repair synthesis in primary human fibroblasts by incorporation of ethynyl deoxyuridine (EdU). Nucleic Acids Res 37(4): e31.
- Luijsterburg, M. S., von Bornstaedt, G., Gourdin, A. M., Politi, A. Z., Mone, M. J., Warmerdam, D. O., Goedhart, J., Vermeulen, W., van Driel, R. and Hofer, T. (2010). Stochastic and reversible assembly of a multiprotein DNA repair complex ensures accurate target site recognition and efficient repair. J Cell Biol 189(3): 445-463.
- Marteijn, J. A., Lans, H., Vermeulen, W. and Hoeijmakers, J. H. (2014). Understanding nucleotide excision repair and its roles in cancer and ageing. Nat Rev Mol Cell Biol 15(7): 465-481.
- Ogi, T., Limsirichaikul, S., Overmeer, R. M., Volker, M., Takenaka, K., Cloney, R., Nakazawa, Y., Niimi, A., Miki, Y., Jaspers, N. G., Mullenders, L. H., Yamashita, S., Fousteri, M. I. and Lehmann, A. R. (2010). Three DNA polymerases, recruited by different mechanisms, carry out NER repair synthesis in human cells. Mol Cell 37(5): 714-727.
- Postma, M. and Goedhart, J. (2019). PlotsOfData-A web app for visualizing data together with their summaries. PLoS Biol 17(3): e3000202.
- Salic, A. and Mitchison, T. J. (2008). A chemical method for fast and sensitive detection of DNA synthesis in vivo. Proc Natl Acad Sci U S A 105(7): 2415-2420.
- van den Heuvel, D., van der Weegen, Y., Boer, D. E. C., Ogi, T. and Luijsterburg, M. S. (2021). Transcription-Coupled DNA Repair: From Mechanism to Human Disorder. Trends Cell Biol 31(5): 359-371.
- van Hoffen, A., Venema, J., Meschini, R., van Zeeland, A. A. and Mullenders, L. H. (1995). Transcription-coupled repair removes both cyclobutane pyrimidine dimers and 6-4 photoproducts with equal efficiency and in a sequential way from transcribed DNA in xeroderma pigmentosum group C fibroblasts. EMBO J 14(2): 360-367.
- van Toorn, M., Turkyilmaz, Y., Han, S., Zhou, D., Kim, H. S., Salas-Armenteros, I., Kim, M., Akita, M., Wienholz, F., Raams, A., et al. (2022). Active DNA damage eviction by HLTF stimulates nucleotide excision repair. Mol Cell 82(7): 1343-1358 e1348.
- Verbruggen, P., Heinemann, T., Manders, E., von Bornstaedt, G., van Driel, R. and Hofer, T. (2014). Robustness of DNA repair through collective rate control. PLoS Comput Biol 10(1): e1003438.
Article Information
Publication history
Accepted: Dec 18, 2022
Published: Feb 5, 2023
Copyright
© 2023 The Authors; exclusive licensee Bio-protocol LLC.
How to cite
van der Meer, P., van den Heuvel, D. and Luijsterburg, M. S. (2023). Unscheduled DNA Synthesis at Sites of Local UV-induced DNA Damage to Quantify Global Genome Nucleotide Excision Repair Activity in Human Cells. Bio-protocol 13(3): e4609. DOI: 10.21769/BioProtoc.4609.
Category
Molecular Biology > DNA > DNA damage and repair
Cell Biology > Cell imaging > Fluorescence
Do you have any questions about this protocol?
Post your question to gather feedback from the community. We will also invite the authors of this article to respond.
![]() Tips for asking effective questions
Tips for asking effective questions
+ Description
Write a detailed description. Include all information that will help others answer your question including experimental processes, conditions, and relevant images.