
- Submit a Protocol
- Receive Our Alerts
- EN

- Protocols

- Articles and Issues
- For Authors
- About
- Become a Reviewer

The Assessment of Beta Cell Mass during Gestational Life in the Mouse
Published: Vol 13, Iss 6, Mar 20, 2023 DOI: 10.21769/BioProtoc.4641 Views: 310
Reviewed by: RAMESH KUDIRAAnonymous reviewer(s)
Original research article
The authors used this protocol in:

Apr 2021

Protocol Collections
Comprehensive collections of detailed, peer-reviewed protocols focusing on specific topics


Abstract
Successful advancement in the treatment of diabetes mellitus is not possible without well-established methodology for beta cell mass calculation. Here, we offer the protocol to assess beta cell mass during embryonic development in the mouse. The described protocol has detailed steps on how to process extremely small embryonic pancreatic tissue, cut it on the cryostat, and stain tissue slides for microscopic analysis. The method does not require usage of confocal microscopy and takes advantage of enhanced automated image analysis with proprietary as well as open-source software packages.
Background
This protocol offers state-of-art detailed steps to assess beta cell mass on immunofluorescent (IF)-stained sections of pancreatic tissue. Quite frequently, beta cell area and mass estimation are heavily biased due to examination of too few (often just 2–3) sections of the pancreatic tissue. Here, we offer an unbiased novel approach to cut through the pancreatic tissue and make representative layers as well as backup slides for later staining. Using our approach, the number of sections and tissue levels that are necessary to accurately estimate the size of beta cell mass is dependent only on the pancreas developmental stage. Moreover, this protocol yields consistent estimations of beta cell mass among individual samples per single treatment group.
Materials and Reagents
Pair of straight sharp non-serrated forceps (Fisher Scientific, catalog number: 12000127)
Pair of 1 cc syringes (McKesson, catalog number: 16-ST1C) with 30.5 G needles (BD, catalog number: 305106)
Petri dishes (Corning, catalog number: 351029)
500 mL Stericup Quick Release Millipore Express PLUS 0.22 μm filter unit (Millipore, catalog number: S2GPU05RE)
250 mL Stericup Quick Release Millipore Express PLUS 0.22 μm filter unit (Millipore, catalog number: S2GPU02RE)
Super Pap-pen, small (Electron Microscopy Sciences, catalog number: 71312)
Invisible tape (Staples, catalog number: 487908)
Adhesive glass slide 75 × 25 × 1 mm (Matsunami, catalog number: SUMGP12)
Immunofluorescence (IF) staining tray (Simport Scientific, catalog number: M9202)
Neo Micro cover glass (Matsunami, catalog number: 24x50)
Nail polish (Electron Microscopy Sciences, catalog number: 72180)
Paper towel (Scott Kimberly-Clark Professional, catalog number: 09-24-589-0-06)
15 mL conical tubes (Thermo Fisher Scientific, catalog number: 339651)
50 mL conical tubes (Thermo Fisher Scientific, catalog number: 339653)
Weigh boats (Electron Microscopy Sciences, catalog number: 70042)
BALB/cJ male mice (The Jackson Laboratory, catalog number: 000651)
Prechilled PBS pH 7.4 (Gibco, catalog number: 10010-023)
Paraformaldehyde (PFA) 8% aqueous solution, EM grade (Electron Microscopy Sciences, catalog number: 157-8)
Sucrose (Macron Fine Chemicals, catalog number: 8360-06)
OCT compound (Scigen, catalog number: 4586)
Biopsy cryomold (Sakura Tissue-Tek, catalog number: 4565)
Dry ice pellets
100% ethanol
Fisherfinest chemically resistant marker (Fisher Scientific, catalog number: 22-026-700)
Bovine serum albumin (BSA) (fraction V) (Fisher Bioreagents, catalog number: BP1600-100)
Sodium azide (Sigma, catalog number: S-8032)
Anti-insulin mouse Alexa-647 (BD, catalog number: 565689)
Anti-glucagon mouse Alexa-594 (SantaCruz, catalog number: sc-514592 AF594)
Anti-somatostatin mouse Alexa-488 (BD, catalog number: 566032)
Shandon Immu-Mount (Thermo Fisher Scientific, catalog number: 9990402)
DAPI (4’,6-diamidino-2-phenylindole, dihydrochloride) (Thermo Fisher Scientific, catalog number: D1306)
30% sucrose (see Recipes)
5% BSA with 0.1% sodium azide (see Recipes)
DAPI in slide mounting media (see Recipes)
Equipment
Scissors (Fisher Scientific, catalog number: 13820002)
Dissecting microscope with mirror and light below (Olympus, model: SZX7)
Cryostat (Microm, model: HM 525)
pH meter (Mettler Toledo, model: S220)
IF-capable microscope or IF Virtual Slide scanner (Olympus VS 120, Zeiss AxioScan Z1)
Analytical weigh scale (Mettler Toledo, model: XS105)
Software
Visiopharm 2021.07 or later
Alternatively:
ImageJ with Trainable Weka Segmentation plugin (Arganda-Carreras et al., 2017).
Procedure
Setting up timed pregnancy in mice
Place each male mouse into an individual cage, twice the number needed for each night of breeding. For example, if 5 male mice will be used for breeding at a given night, then 10 male mice should be set up. Let the animals rest for one night.
At the end of the day (approximately between 4:00 and 6:00 PM), place one female mouse with each individual male and leave the remaining half of single-housed male mice alone.
Next morning, check each female mouse for the presence of a vaginal plug (Figure 1), which suggests successful breeding. Tag the plugged female mice, measure their body weight, and place them in a new cage. This day is referred to as E0.5. Make appropriate notes in your notebook or on the computer, including the mouse number and the day when the vaginal plug was confirmed, as well as the body weight of the mouse at the day of the vaginal plugging.

Figure 1. Vaginal plug (indicated by an orange arrow) during morning assessment after overnight breeding of Balb/c female mouseRepeat breeding with the second half of males during following night. Let the first half of males, which were used during the first night of breeding, to rest. Continue this mating strategy until all desired females are plugged. In order to facilitate execution of experimental design for specific embryonic days and correctly predict experimental needs utilizing a timed-pregnancy model, we created a dedicated MS Excel program (YKTPPaL.xsls).
At 10 days after E0.5, check the body weight of female mice. An increase by more than 2 g strongly suggests pregnancy (accordingly, the age of embryos is considered E10.5 at this stage) (Heyne et al., 2015). Apply any experimental and control treatment, as originally designed. Alternatively, the treatments can be initiated at E0.5, although this approach requires additional mice as not all plugged female mice become pregnant.
Tissue processing and freezing
Euthanize pregnant mice according to the IACUC approved protocol.
Prepare ice bucket with the following Petri dishes (Figure 2):
One dish with PBS for initial placement of embryos
One dish with PBS for individually separated embryos
Two dishes with PBS for pancreatic tissue isolation from each embryo being processed
One or more Petri dish lids for tissue processing (Figure 3)
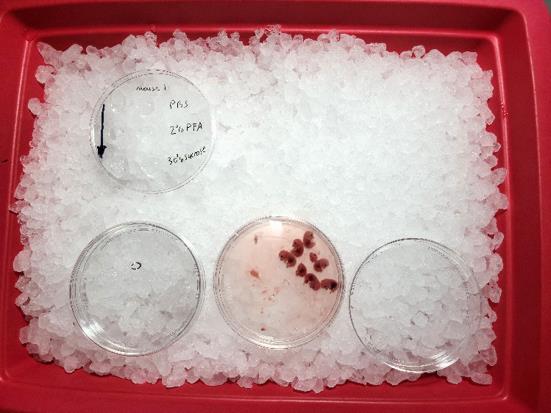
Figure 2. Preparation for embryonic pancreas isolation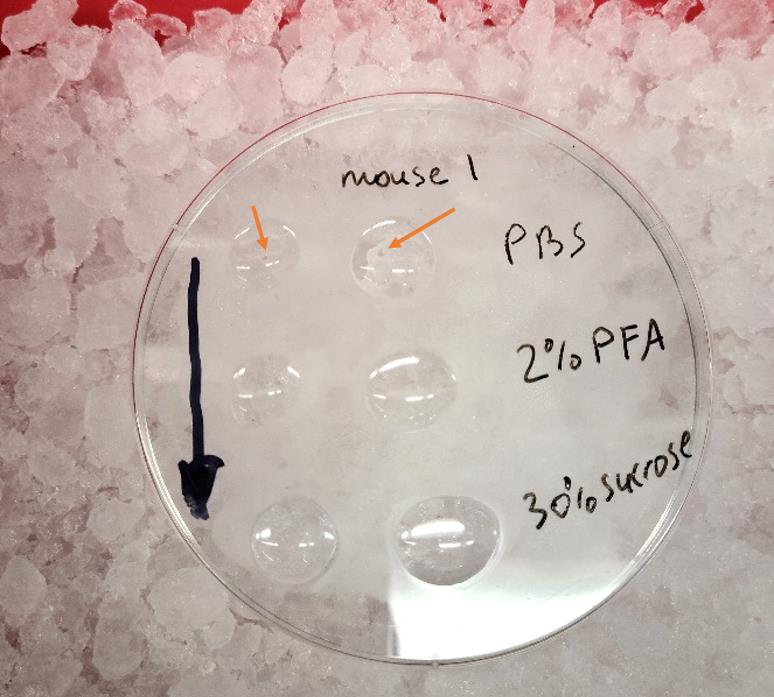
Figure 3. The processing steps of embryonic pancreatic tissue, E12.5 (indicated by orange arrows)Harvest pancreatic tissue as desired (e.g., at E12.5, E14.5, and E16.5) (Video 1). If experimental design and conditions permit, it is better to euthanize only one pregnant mouse at a time and process its litter. Proceed then with euthanasia of the next pregnant mouse and processing of its litter. With good skills, each pancreatic sample can be consistently obtained within 2–4 min. Specifically, we were successful with up to two litters at the same time.
 Video 1. Dissecting technique of developing pancreatic tissue during mouse embryogenesis
Outline with Pap-pen three circles per pancreatic rudiment as needed on Petri dish lids and fill them up with PBS, 2% PFA, and 30% sucrose, respectively. Gently, place each isolated pancreatic tissue in a circle with PBS (Figure 3).
This step can be simplified by pulling pancreatic rudiments from the same experimental group into one processing circle. For example, pancreatic rudiments at E12.5 treated with control/vehicle can be placed into one processing circle, as long as it is the only parameter being assessed during the study.
If each pancreatic rudiment has its own unique features, e.g., genotype, type of treatment, gender, etc., then they should be placed into individual processing circles.
With the help of dissecting microscope and 1 cc syringe with 30 G needle, transfer isolated samples into the PAP-pen circles containing 2% PFA for 2–4 h at room temperature (RT). Next, transfer samples into the last circle with 30% sucrose until they sink down to the bottom of solution (Video 2).
Video 2. Embryonic pancreatic tissue explant processing technique for cryopreservationPrepare Tissue-Tek biopsy cryomolds: label molds with chemically resistant marker and tape with clear tape over marker writing. Fill up the molds with OCT compound. Using the syringe with 30 G angled or straight needle, transfer samples from sucrose circle into the mold with OCT under the dissecting microscope. Position the sample in the middle depth of the mold. Repeat it for all samples.
Crush dry ice with mortar and pestle into very small pieces and transfer it into a borosilicate container filled up with 100% ethanol, to make freezing solution.
Quickly, under the dissecting microscope and using syringe with 30 G needle, push pancreatic sample to the bottom of the mold, making sure the tissue is oriented in the middle of the most bottom area (Figure 4). Place the mold on top of the dry ice/ethanol bath for freezing. Repeat freezing procedure for all samples as quickly as possible.
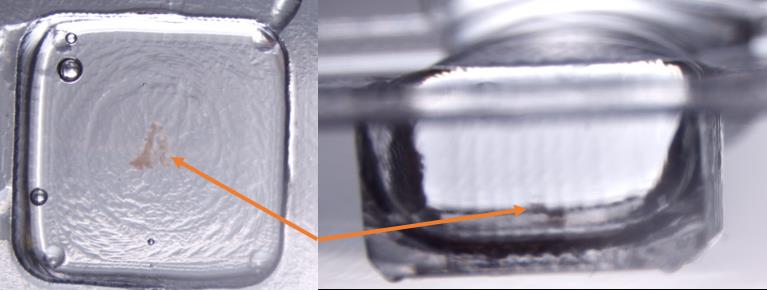
Figure 4. Placement of embryonic pancreatic tissue E16.5 in the cryomold
Tissue cutting
Since embryonic pancreatic rudiments (especially at E12.5–E14.5) are very tiny, it is important to freeze them in the middle of the most bottom area of cryomold. This approach will make tissue visible as a brown-to-yellow dot and facilitate its finding for cutting on cryostat. For a backup, each slide should be cut in duplicate. All tissue levels obtained from a single pancreatic rudiment should be positioned in sequential order on 1–2 slides. The thickness of sections should be 5 μm.
First tissue section is referred to as level one (e.g., level 1 section 1) and should be placed on the first slide in the top left corner, allowing a reasonable distance to the edge of the slide. The very next pancreatic section is referred to as a duplicate section of the first layer (e.g., level 1 section 2) and should be placed in the same spot of duplicate slide. Repeat this cutting technic until all pancreatic tissue is cut through.
Using the above-described approach, E12.5 pancreatic section levels are spaced approximately 15 μm apart. For level separation of larger embryonic pancreatic tissue, make an additional seven (E14.5) or ten (E16.5) cuts (5 μm each) into waste to space adjacent levels to 35 and 50 μm apart, respectively. The total level output may vary and be dependent on treatment and genotype. On average, expect 10–14 tissue levels per single pancreatic bud (Table 1 and Figure 5).
Table 1. Recommendation of pancreatic tissue cutting in relation to its size
Pancreas size Main slide section per level Duplicate slide section per level 5 µm cuts to waste (skip) Distance between levels, µm Levels per pancreas E12.5 1 1 0 15 10–12 E14.5 1 1 7 35 10–14 E16.5 1 1 10 50 10–14 E18.5 1 1 10 50 10–14 0P 1 1 12 60 10–14 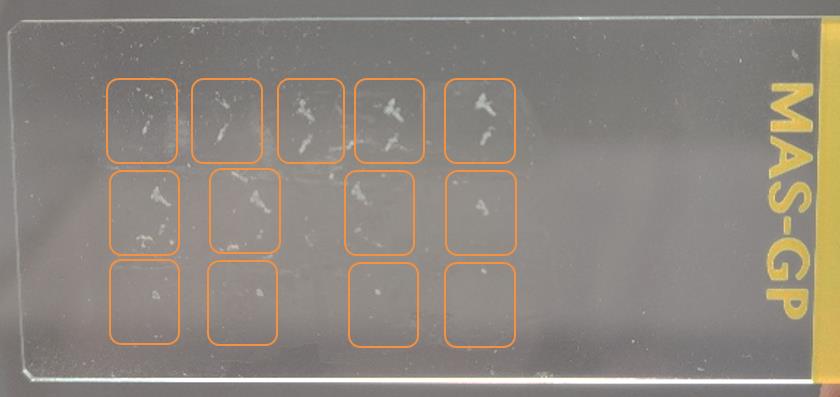
Figure 5. E14.5 Embryonic pancreas sections (outlined with orange rectangles) from level 1 through 13 (left to right, top to bottom) on a slideNote that depending on experimental needs, it is possible to prepare additional backup slides of pancreatic tissue starting at E14.5. Accordingly, the number of 5 μm cuts to be skipped into waste should be decreased (Table 2).
Table 2. Example of pancreatic tissue cutting recommendation with three backup slides
Pancreas size Main slide section per level Duplicate slide section per level 5 µm cuts to waste (skip) Distance between levels, µm Levels per pancreas E16.5 1 3 8 50 10–14 Store slides in a -80 °C freezer in slide boxes. Slides can be stored for up to four years.
IF staining
De-freeze and dry slides at RT. Keep duplicate slides frozen as backup. Outline a big circle around all tissue sections on each slide with PAP-pen.
Add 5% BSA dropwise on a slide to cover tissue sections. Incubate 30–60 min at RT in moisturized IF staining tray.
Prepare working dilution of mouse anti-insulin Alexa-647 antibody in 5% BSA (the dilution factor will depend on the microscope and lot of the antibody). If needed, you can combine this antibody with anti-glucagon Alexa-594 and anti-somatostatin Alexa-488 antibodies.
For example, we successfully used a combination of anti-insulin Alexa-647 (1:500), anti-glucagon Alexa-594 (1:1,000), and anti-somatostatin Alexa-488 (1:200) Abs together in a single-step staining procedure (Figure 6).
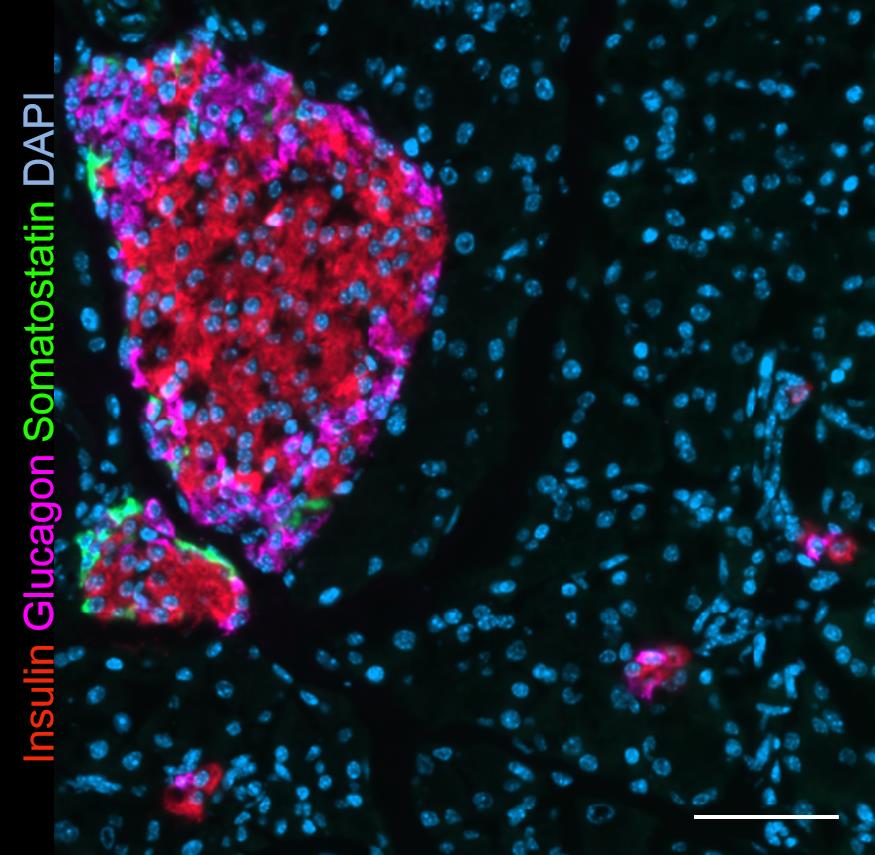
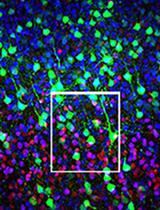
Figure 6. 23P pancreas section stained simultaneously with antibodies to insulin (Alexa-647, red), glucagon (Alexa-594, purple), and somatostatin (Alexa-488, green). 20× magnification. Scale bar, 50 μm.Remove excess BSA solution from slide by blotting the edge of the slide against paper towel and add 100 μL of Abs working solution on each slide. Cover moisturized staining tray with a lid and incubate in dark at 4 °C overnight.
The following morning, remove excess of staining solution from the slide by blotting the edge of the slide against paper towel, and place the slide in a Coplin jar with PBS for 5 min. Remove excess of PBS solution and repeat washing step one more time.
Place two coverslips on a paper towel and add one bubble-free drop of mounting media with DAPI in the center of the coverslip.
Take the slide out from washing Coplin jar, blot its edge against paper towel, quickly swing it in the air to remove residual PBS and, with tissue sections facing down, put it on a coverslip with DAPI mounting media. Repeat it for a second slide. The weight of the slide will help to evenly spread out DAPI mounting media across the tissue sections. Repeat this step for all slides in the staining batch.
Air dry slides in dark for 60–120 min and apply nail polish around the edge of coverslip to seal the slide for long-term storage. Slides are ready for microscopy, but if time permits, cure slides at 4 °C overnight for best autofocusing results.
Microscopy
Take pictures of each tissue section with an IF camera–equipped microscope by focusing on a DAPI channel. For small tissue samples (e.g., E12.5), at most instances a single field of view at 20× will fit the entire tissue section. For bigger sections (e.g., E13.5 and older) it will be necessary to take overlapping pictures of different fields of view and stitching them together in a photo-editing software. Alternatively, a virtual microscope slide scanner (e.g., Zeiss Axioscan Z1, Olympus V120) can be effectively used to automatically photograph, using DAPI channel as an autofocusing channel, and stich tissue sections together for further analysis (Figure 7). As a general rule of better autofocusing, it is recommended to set up a shorter exposure time (faster DAPI focusing), and DAPI signal intensity should not exceed 30%–50% of its maximum histogram value.
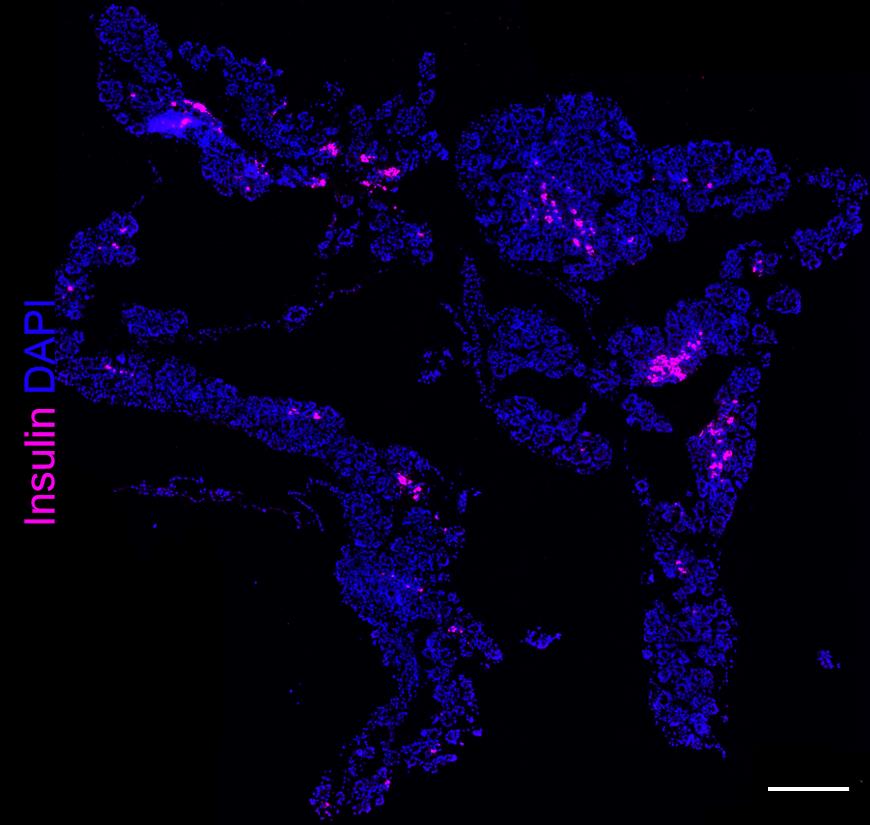
Figure 7. E16.5 pancreas section stained with anti-insulin Alexa-647 Ab with multiple fields of view stitched together. 2× magnification. Scale bar, 500 µm.Image analysis
Use software (e.g., Visiopharm software with Author module) for multicolored IF imaging (Figure 8A):
Uncheck all unnecessary staining channels (e.g., amylase, CK19, and DAPI, as shown in Figure 8A) and draw small regions corresponding to at least three classes for segmentation purposes: ins+ (staining positive for insulin), the tissue (tissue area stained negatively for insulin), and background (slide area without tissue) (Figure 8B and 8G).
If necessary, apply preprocessing step to better prepare image for segmentation (in example described in Figure 8, we used a mean filter on insulin-staining channel, which helps to negate and equalize individual pixel variations in the background and specific staining patterns) and train a software, using Bayesian algorithm (or any other one suited for a given task). Make sure that the software can consistently recognize these areas (Figure 8C and 8G).
Using postprocessing steps, remove unnecessary labels and small artifacts. In the example shown in Figure 8D and 8G, the label “background” was removed completely as it was not used in further calculations. The smallest ins+ spots measuring less than 12 μm in diameter and “tissue” labels measuring less than 20 μm in diameter also were removed as they usually represent artifacts.
Perform segmentation of the entire image (Figure 8E) and, if necessary, check its consistency with other stains (Figure 8F).
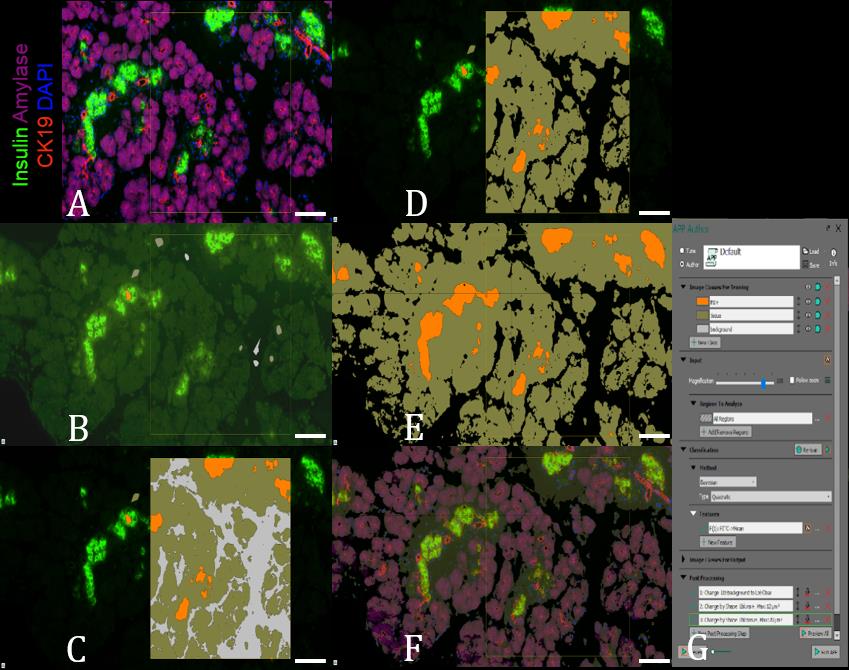
Figure 8. E16.5 pancreas, stained for insulin (green), amylase (purple), cytokeratin 19 (red), and nuclei (blue) was preprocessed, segmented, and fine-tuned (A-F) by using Visiopharm software Author module (G). 14× magnification. Scale bar, 100 µm.Comparable results can be obtained using open-sources software, including ImageJ/FiJi with Trainable Weka Segmentation package (Heyne et al., 2015).
For each pancreatic sample, calculate the following parameters:
Total area occupied by insulin-producing cells
Total tissue section area
Calculate the percentage of area occupied by insulin-producing cells, according to the following formulas:
Area occupied by insulin-producing cells/(tissue area + insulin-positive area) × 100% (if total section area value does not include insulin-positive area) or:
Area occupied by insulin-producing cells/(tissue area) × 100% (if total section area value includes insulin-positive area already)
Calculate beta cell mass: % of area occupied by insulin-producing cells × pancreas weight expressed in mg (optional if weighting scale permits such a small, consistent reading).
For example, E16.5 healthy Balbc/cJ pups, on average, have 0.3857% ± 0.02327 of insulin-positive beta cell area (Kryvalap et al., 2021).
Recipes
30% sucrose
Dissolve 300 g of sucrose in 500 mL of PBS on a magnetic stirrer until solution becomes clear.
Add distilled water up to 1,000 mL.
Sterilize solution with two units of Stericup Quick Release Millipore Express PLUS 0.22 μm filters, aliquot into 50 mL conical tubes, and store at 4 °C.
5% BSA with 0.1% sodium azide
Prepare 10% stock solution of sodium azide: dissolve 10 g of sodium azide in 50 mL of distilled water on a magnetic stirrer until solution becomes clear. Add distilled water up to 100 mL. Store at room temperature.
Prepare 5% BSA in PBS: dissolve 12.5 g of BSA (fraction V) in 150 mL of PBS pH 7.4 on a magnetic stirrer until solution becomes clear. Add PBS up to 250 mL.
Add 2.5 mL of 10% sodium azide to the 5% BSA solution. Mix well.
(optional) Pass through a 250 mL Stericup Quick Release Millipore Express PLUS 0.22 μm filter unit to clear up solution. Store at 4 °C.
DAPI in slide mounting media
Make 14.3 mM DAPI stock: to the vial with 10 mg of DAPI, add 2 mL of distilled water. Vortex well. Aliquot and store at -20 °C.
Add 1 μL of 14.3 mM DAPI stock solution into the bottle with 20 mL of mounting media. Cover with foil and rotate it to mix on a shaker for 1 h at RT. Store at 4 °C and protect from the light.
Acknowledgments
Some of the work described in the manuscript was supported by grants from the Juvenile Diabetes Research Foundation (grant 17-2012-428) and the American Diabetes Association (grant 1-17-ICTS-083). This protocol is derived from the original research paper (Kryvalap et al., 2021; DOI: 10.1126/scitranslmed.abf1587).
Competing interests
The authors declare no duality of interest associated with this manuscript.
References
- Arganda-Carreras, I., Kaynig, V., Rueden, C., Eliceiri, K. W., Schindelin, J., Cardona, A. and Sebastian Seung, H. (2017). Trainable Weka Segmentation: a machine learning tool for microscopy pixel classification. Bioinformatics 33(15): 2424-2426.
- Heyne, G. W., Plisch, E. H., Melberg, C. G., Sandgren, E. P., Peter, J. A. and Lipinski, R. J. (2015). A Simple and Reliable Method for Early Pregnancy Detection in Inbred Mice. J Am Assoc Lab Anim Sci 54(4): 368-371.
- Kryvalap, Y., Jiang, M. L., Kryvalap, N., Hendrickson, C. and Czyzyk, J. (2021). SerpinB13 antibodies promote β cell development and resistance to type 1 diabetes. Sci Transl Med 13(588): eabf1587.
Article Information
Publication history
Published: Mar 20, 2023
Copyright
© 2023 The Author(s); This is an open access article under the CC BY-NC license (https://creativecommons.org/licenses/by-nc/4.0/).
How to cite
Kryvalap, Y. and Czyzyk, J. (2023). The Assessment of Beta Cell Mass during Gestational Life in the Mouse. Bio-protocol 13(6): e4641. DOI: 10.21769/BioProtoc.4641.
Category
Developmental Biology > Morphogenesis > Cell structure
Cell Biology > Cell imaging > Cryosection
Do you have any questions about this protocol?
Post your question to gather feedback from the community. We will also invite the authors of this article to respond.
![]() Tips for asking effective questions
Tips for asking effective questions
+ Description
Write a detailed description. Include all information that will help others answer your question including experimental processes, conditions, and relevant images.