
- Submit a Protocol
- Receive Our Alerts
- EN

- Protocols

- Articles and Issues
- For Authors
- About
- Become a Reviewer

Absolute Quantification of mRNA Isoforms in Adult Stem Cells Using Microfluidic Digital PCR
Published: Vol 13, Iss 17, Sep 5, 2023 DOI: 10.21769/BioProtoc.4811 Views: 260
Reviewed by: Philipp WörsdörferSébastien GillotinHeng Sun
Original research article
The authors used this protocol in:

Nov 2019

Protocol Collections
Comprehensive collections of detailed, peer-reviewed protocols focusing on specific topics


Abstract
Adult stem cells play key roles in homeostasis and tissue repair. These cells are regulated by a tight control of transcriptional programs. For example, muscle stem cells (MuSCs), located beneath the basal lamina, exist in the quiescent state but can transition to an activated, proliferative state upon injury. The control of MuSC state depends on the expression levels of myogenic transcription factors. Recent studies revealed the presence of different mRNA isoforms, with distinct biological regulation. Quantifying the exact expression levels of the mRNA isoforms encoding these myogenic transcription factors is therefore key to understanding how MuSCs switch between cell states. Previously, quantitative real-time polymerase chain reaction (qRT-PCR) has been used to quantify RNA expression levels. However, qRT-PCR depends on large amounts of RNA input and only measures relative abundance. Here, we present a protocol for the absolute quantification of mRNA isoforms using microfluidic digital PCR (mdPCR). Primary MuSCs isolated from individual skeletal muscles (gastrocnemius and masseter) are lysed, and their RNA is reverse-transcribed into cDNA and copied into double-stranded DNA. Following exonuclease I digestion to remove remaining single-stranded DNA, the samples are loaded onto a mdPCR chip with TaqMan probes targeting the mRNA isoforms of interest, whereupon target molecules are amplified in nanoliter chambers. We demonstrate that mdPCR can give exact molecule counts per cell for mRNA isoforms encoding the myogenic transcription factor Pax3. This protocol enables the absolute quantification of low abundant mRNA isoforms in a fast, precise, and reliable way.
Graphical overview
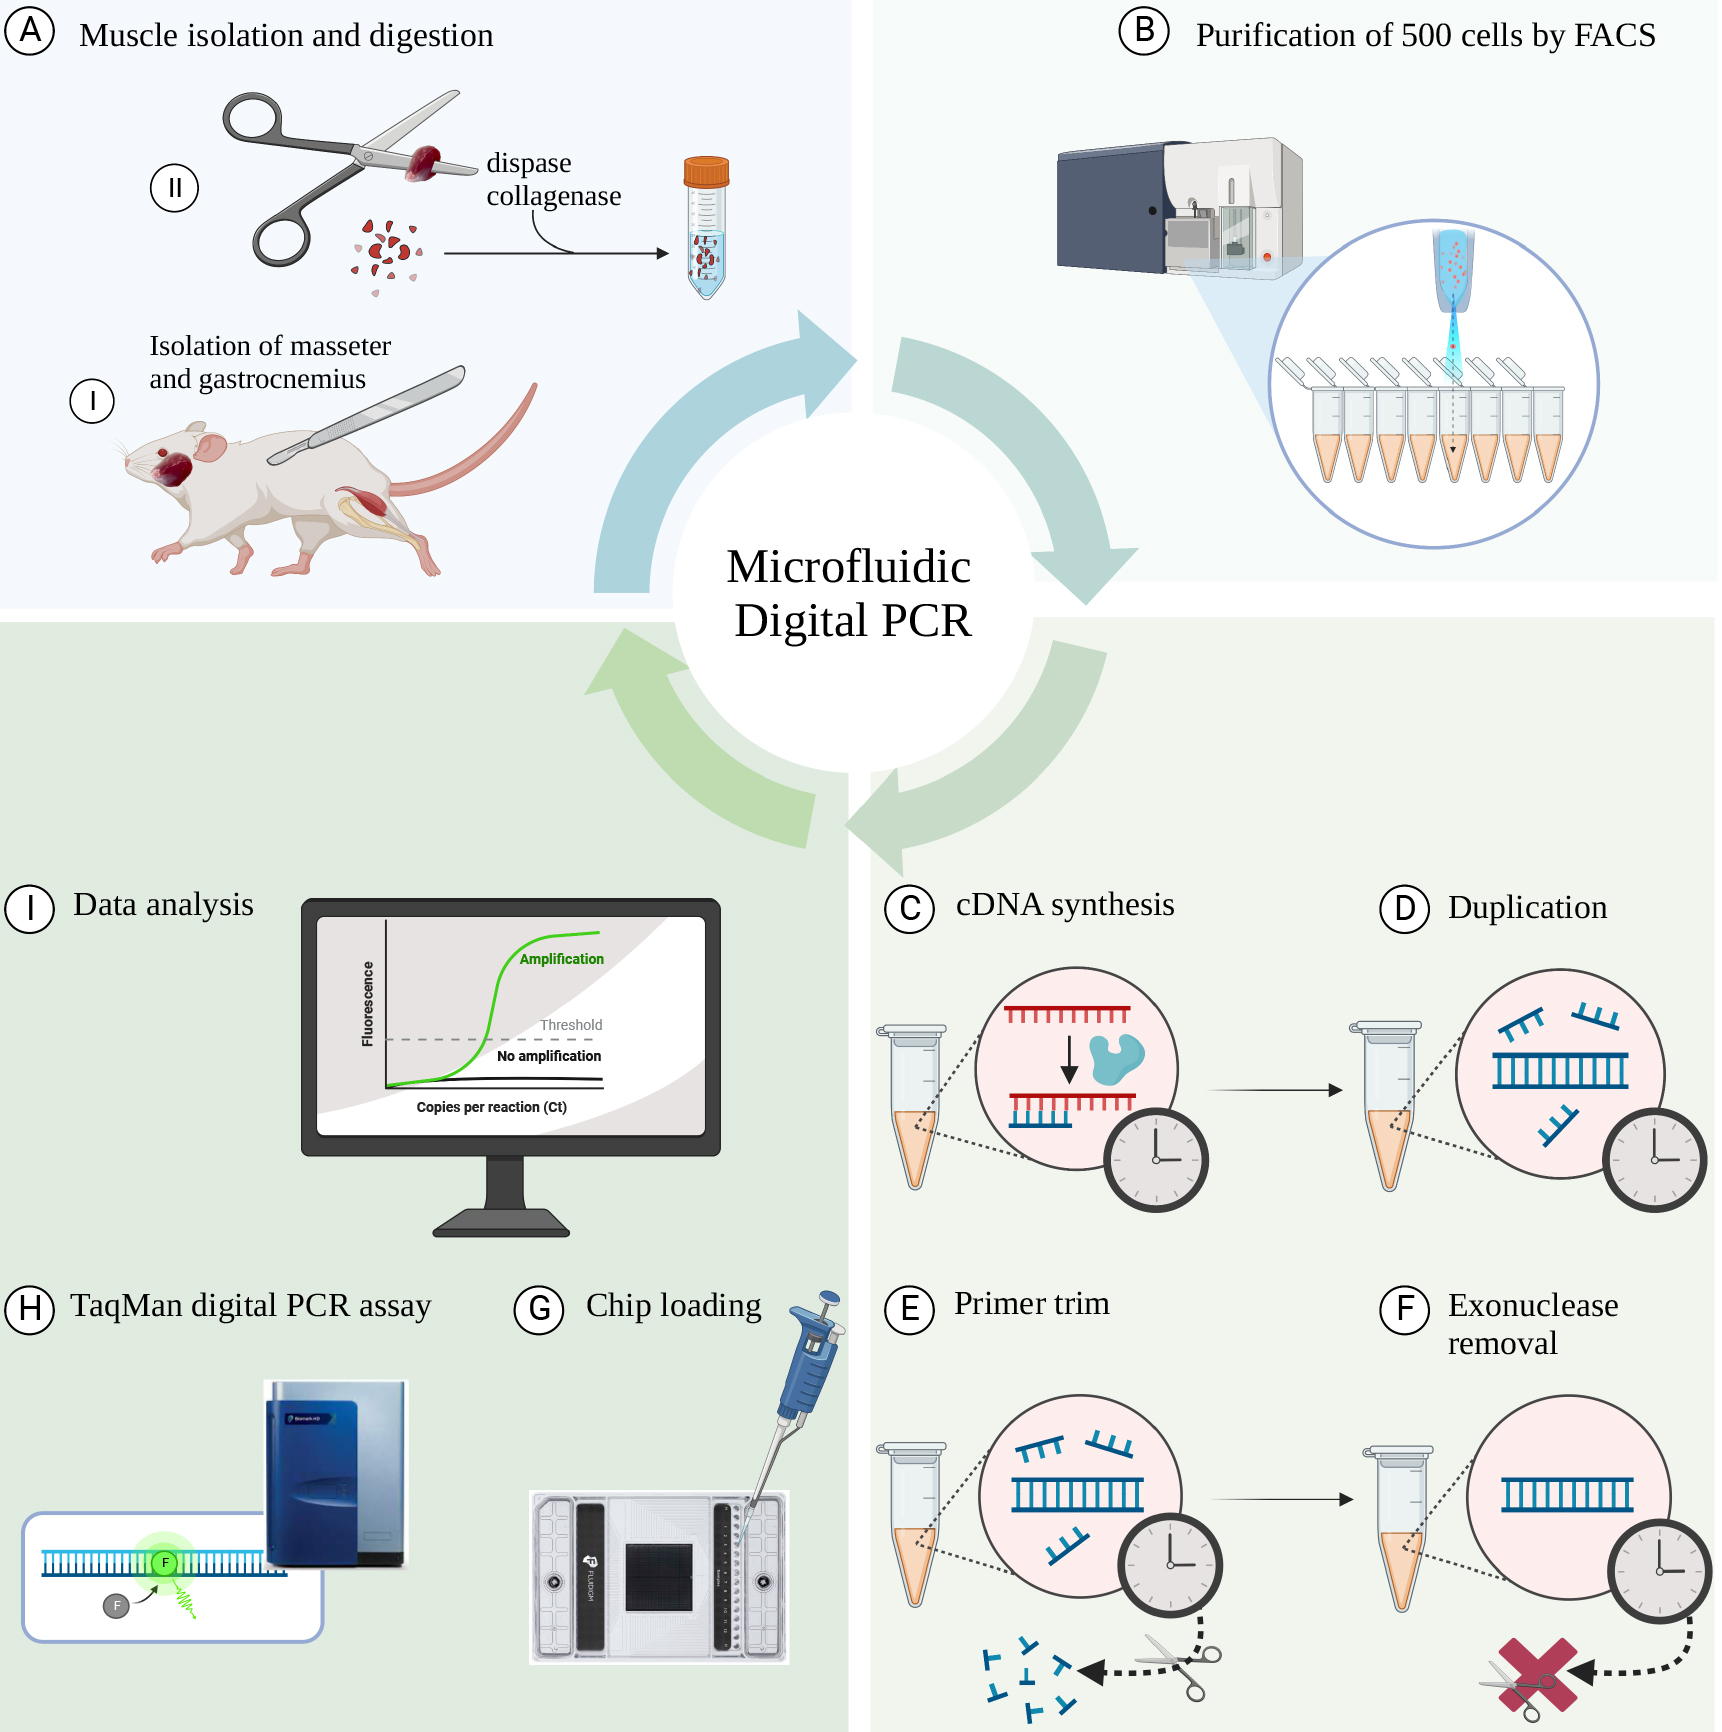
Schematic overview of the workflow. (A) Isolation of individual muscles (gastrocnemius and masseter) from C57/BL6 mice followed by digestion using collagenase II and dispase. (B) Sorting of 500 cells directly into PCR tubes using fluorescence-activated cell sorting (FACS). (C) Reverse transcription of mRNA to cDNA. (D) Polymerase reaction to generate a duplicated cDNA product. (E) Exonuclease I digestion to remove remaining single-stranded DNA and the non-hybridized primers. (F) Denaturation step to inactivate exonuclease I. (G) Loading the samples into the microfluidic chip. (H) Running the TaqMan Digital PCR assay in the Fluidigm Biomark HD real-time PCR machine. (I) Data analysis using the Digital PCR software.
Background
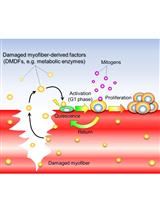
Muscle stem cells (MuSCs) reside beneath the basal lamina of skeletal muscle fibers and maintain a state of quiescence (de Morree and Rando, 2023). Upon injury, the MuSCs switch from quiescence to activation, giving rise to proliferating progenitors that will eventually differentiate and fuse with myofibers (Yin et al., 2013;Relaix et al., 2021). To understand the exit from quiescence and how the myogenic fate is determined, it is important to understand the factors that maintain or break the quiescent state The transcription factor Pax3 plays a key role in myogenesis. In the absence of Pax3, embryonic MuSCs fail to expand and migrate, and no muscle is formed, resulting in embryonic lethality (Relaix et al., 2005). Recent work revealed that thePax3gene generates multiple mRNA isoforms with different 3′UTRs in MuSCs from adult mice (Boutet et al., 2012; de Morree et al., 2019). One of the isoforms of Pax3 mRNA has a long 3′UTR containing microRNA binding sites, is translationally repressed by the microRNA 206, and is linked to quiescence (Figure 1). The other has a short 3′UTR lacking the microRNA binding sites, is not translationally repressed, and is linked to activation and cell cycle entry of MuSCs (de Morree et al., 2019). Therefore, it is important to understand Pax3 isoform expression patterns in MuSCs, as quantifying the two isoforms of Pax3 will contribute to understanding its role in MuSCs quiescence and activation.
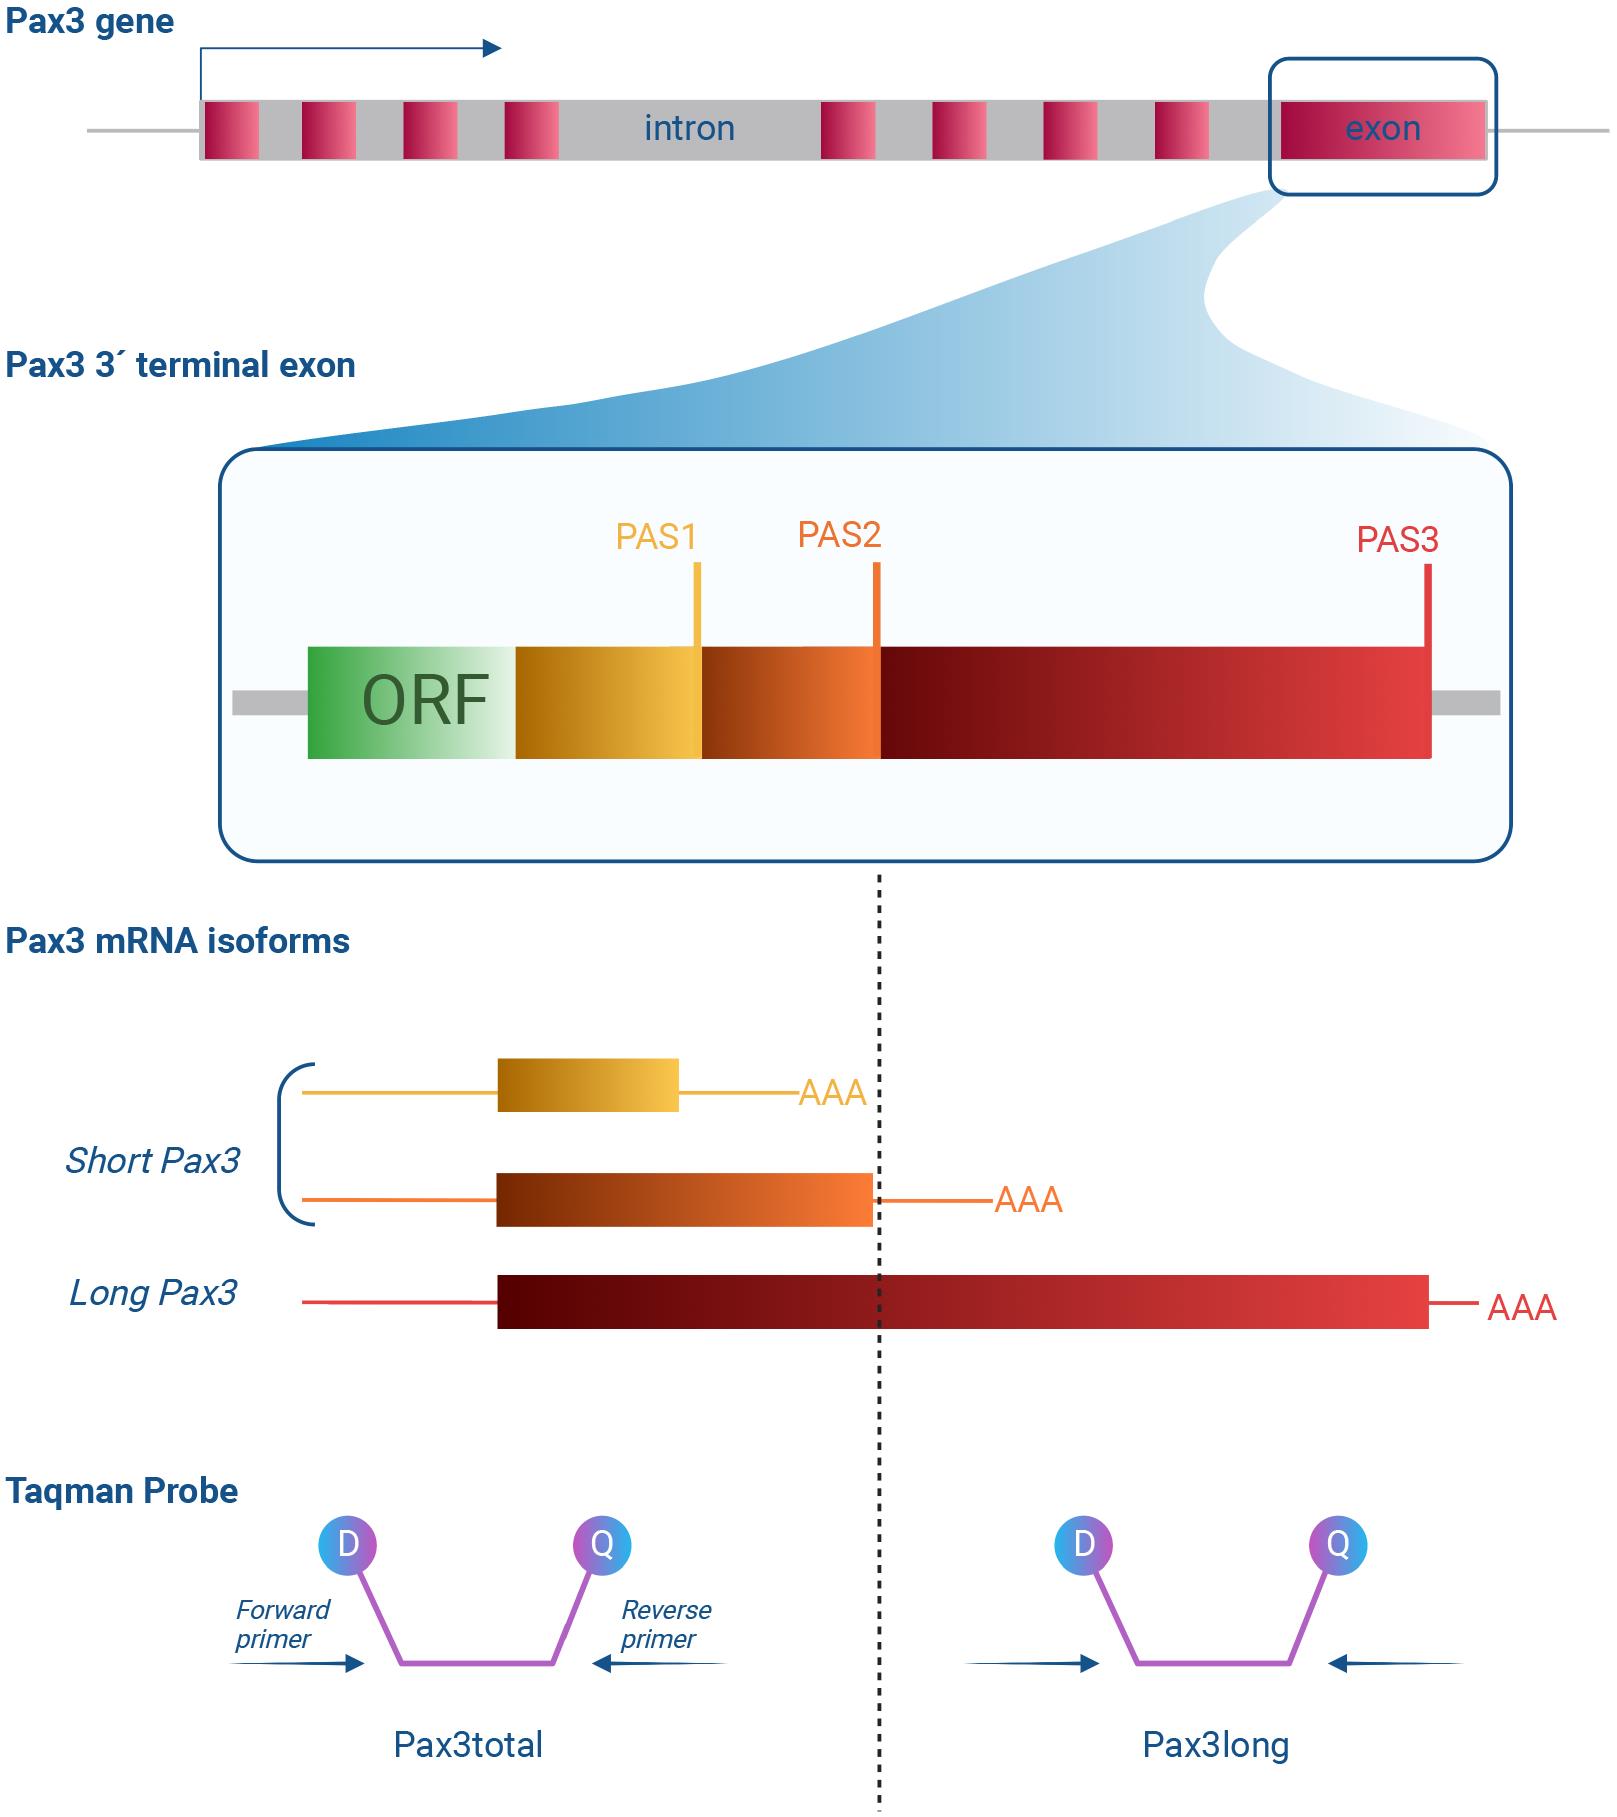
Figure 1. Schematic figure depicting how the TaqMan probes, Pax3total and Pax3long, target their respective target sites on the Pax3 3′ terminal exon. Top: a schematic of thePax3gene with boxes denoting exons. The 3′ terminal exon is enhanced, and the open reading frame (ORF) coding part is highlighted, as well as the three polyadenylation sites (PASs) present in the 3′ untranslated region (3′UTR). Bottom: three major Pax3 mRNA isoforms are represented. All contain the complete ORF (not depicted) but differ in the length of the 3′UTR due to the selection of different PASs. These isoforms can be detected with TaqMan probes. The Pax3total TaqMan probes hybridize to sequences that are present in both long and short isoforms of Pax3. The Pax3long TaqMan probes hybridize to sequences that are present only in long isoform of Pax3. Each TaqMan probe contains a reporter dye and a quencher. During the polymerase reaction, the dye and the quencher are separated from the target sequence; as a result, fluorescence increases.
Quantitative real-time polymerase chain reaction (qRT-PCR) is often considered as the gold standard for measuring mRNA expression levels, despite many factors of variability such as RNA templates, inconsistent data analysis, and data normalization (Nolan et al., 2006). This method uses intercalating fluorescent dyes to assess transcript abundance during a PCR amplification. Though effective, it cannot measure exact copy numbers and requires a reference gene like GAPDH or HPRT to calculate relative expression levels. These reference genes are used because they are considered stably expressed in all cells. However, they may not be (Kozera and Rapacz, 2013). MuSCs undergo a 6-fold increase in size during activation (Rodgers et al., 2014;Brett et al., 2020). Thus, the change in cell volume may affect the interpretation of relative quantification by qRT-PCR, complicating the interpretation of how much Pax3 is expressed in cells. Instead, several adaptations have been made that enable single molecule quantification using a technique called digital PCR (Mao et al., 2019). In digital PCR, the total reaction volume is partitioned into small reaction chambers at a dilution so that 5%–65% of the small reaction chambers contain a single molecule of target cDNA. Then, a PCR amplification is performed to amplify those molecules, enabling the researcher to simply score for each small reaction chamber whether a PCR reaction took place or not. This digital assessment can then be calculated into an exact number of molecules present in the original reaction volume using Poisson statistics. Recent technologies that enable the formation of small droplets (droplet digital PCR) made digital PCR more routinely accessible (Hindson et al., 2013;Mao et al., 2019).
However, while droplet digital PCR enables the low-cost quantification of absolute mRNA levels, there is a variability between droplets that lowers the precision (Emslie et al., 2019), which is key when measuring low-abundant transcripts. Here, we use a parallel technology, microfluidic digital PCR (mdPCR), in which the sample is partitioned in microfluidic nanochambers (see Graphical overview). These nanochambers are uniform and enable highly reproducible amplification reactions, to enable the absolute quantification of low abundant transcripts with high accuracy. We previously applied this protocol to find that MuSCs isolated from lower hindlimb muscle expressed on average three molecules of Pax3 mRNA, two thirds of which were long isoforms. In contrast, MuSCs isolated from the diaphragm muscle expressed on average 10 molecules of Pax3 mRNA, one third of which were long isoforms (de Morree et al., 2019).
This protocol can also be used to quantify mRNA isoforms in other stem cell types, such as muscle-resident fibroadipogenic progenitors, which play important roles in homeostasis and repair of multiple tissues (Joe et al., 2010;Uezumi et al., 2010). The levels of mRNA isoforms can be quantified accurately across different cell states. Expression of disease genes along the progression of a disease can also be studied using mdPCR. Finally, the efficacy of therapies that change relative isoform abundance, such as exon-skipping for Duchenne Muscular Dystrophy, can be assessed with mdPCR (Verheul et al., 2016). Hence, this protocol can be used both in basic biology and translational studies.
Materials and reagents
GE 48.48 Dynamic Array Reagent kit with control line fluid, 10 IFCs (Fluidigm, catalog number: 85000800) (contains the control line fluid, 20× GE Sample Loading Reagent)
TE buffer, pH 8.0 (Teknova, catalog number: T0224)
CellsDirect One Step qRT-PCR kit (Life Technologies Invitrogen, Thermo Fisher Scientific, catalog number: 46-7201)
TaqMan Fast Advanced Master Mix (Applied Biosystems, Thermo Fisher Scientific, catalog number: 444455)
Pipettes (p10, p20, p200, p1000) (Mettler Toledo, Rainin Pipet-Lite XLS+)
Cells of interest (we used MuSCs for the protocol)
Ethanol 70% (v/v) (TechniSolve®, VWR Chemicals)
Exonuclease I and buffer (New England Biolabs, M0658S)
PCR strip of 8,200 μL, PCR performance tested, transparent, PP, flat cap (Sarstedt, catalog number: 72.991.002)
12.765 Digital ArrayTMIFC (Standard Biotools, Fluidigm, BMK-M-12.765)
TaqMan probe Pax3total (Boutet et al., 2012; de Morree et al., 2019): Pax3total_Forward: 5′ GTCAGAGACTGGAACATATGAAGAATGT 3′ Pax3total_Reverse: 5′ GCCTGCGGTGCTATAGGT 3′ Pax3total_Middle: 5′ CTGCCCACATCTCAGC 3′
TaqMan probe Pax3long (Boutet et al., 2012; de Morree et al., 2019): Pax3long_Forward: 5′ TGTGTTAGCAGGACTAGACATAGAACT 3′ Pax3long_Reverse: 5′ TTGAGGCTGCAACACAAAGATACTA 3′ Pax3long_Middle: 5′ CACCCTGCCCAACGTA 3′
RNaseZap™ RNase Decontamination solution (ThermoFisher Scientific, catalog number: AM9780)
Equipment
BioMark HD PCR machine (Fluidigm)
Integrated Fluidic Circuit (IFC) controller MX (Fluidigm)
Mini centrifuge (Fisherbrand, catalog number: 12006901)
ScanR High Content Screening microscope (Evident, model: OLYMPUS)
BD FACSAriaTMIII Sorter (BD Biosciences, catalog number: 648282-24)
Master Cycler Gradient Thermal Cycler (Eppendorf, catalog number: 5331)
Vortex-Genie 2 (Scientific Industries, SKU: SI-0236)
Software
Digital PCR Analysis Software (Biomark and EP1 software v4.8.1)
GraphPad PRISM (GraphPad Software Inc.)
Fiji image processing package (ImageJ2)
Procedure
Preparation
Program the thermal cycler with protocols for the reverse transcriptase and polymerase step, as well as the exonuclease step.
Set the program for reverse transcription: heat the lid to 105 °C, incubate the sample for 15 min at 50 °C (step to reverse transcribe the RNA to cDNA), then incubate the sample for 2 min at 95 °C (step to inactivate the reverse transcriptase and activate the Taq polymerase), incubate the sample for 15 s at 95 °C, and then incubate the sample for 4 min at 60 °C (specific target amplification, to make double-stranded DNA). Finally, incubate the sample at 4 °C to preserve the DNA.
Set the program for the exonuclease reaction: heat the lid to 105 °C and incubate the sample for 10 min at 37 °C (to digest all single-stranded DNA and the non-hybridized primers). Then, incubate the sample for 10 min at 80 °C (to denature and inactivate the exonuclease). Finally, incubate the sample at 4 °C to preserve the DNA.
Cell sorting
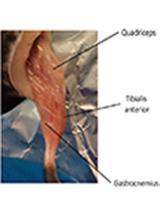
Prepare a single-cell suspension of your cell type of interest. Here, we digested the gastrocnemius (calf muscle) and masseter (jaw muscle) and generated single-cell suspensions (Frimand et al., 2022).
In our experiment, we were interested in MuSCs, which can be isolated based on the cell surface markers CD31, CD45, Sca1 (all negative markers), and Vcam1 (positive marker). We therefore stained our single-cell suspension with antibodies against CD31, CD45, Sca1, and Vcam1 in order to isolate the MuSCs as the Vcam1+/Sca1-/CD31-/CD45- cells, as described previously (Frimand et al., 2022).
Note: If other cell types shall be purified, alternative markers need to be determined.
Start up the FACS ARIA III and perform the CS&T and Accudrop controls following the BD Biosciences Manual. Next, calibrate the droplet position of the FACS. To this end, install the adapter for plate sorting and bring out the plate sorting arm (seeFigure 2).
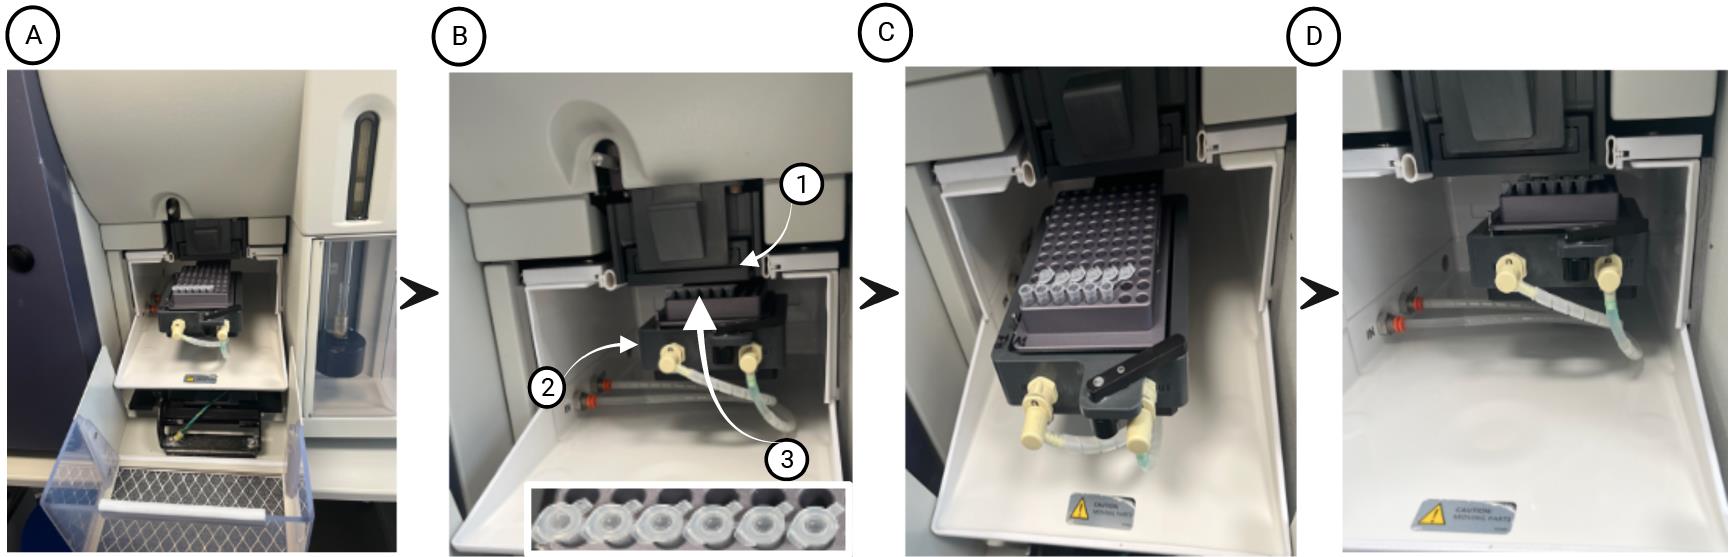
Figure 2. FACS ARIA III cell sorter setup. (A) Setup of the BD Aria 3 sorting arm with 96-well plate holder and a PCR strip inserted into the 96-well plate holder. (B) The sorting arm with 96-well plate holder is moved to the home position. Arrows highlight the plate sort adapter (1), the plate sorting arm (2), and a PCR strip after test sort, showing the test droplet in the center of each lid (3 and inset). (C) PCR strip with lids open inserted into the 96-well plate holder for sorting cells. (D) Sorting 500 cells into each tube of the PCR strip.Insert a PCR strip with lids closed into a 96-well plate holder (Figure 2A), install the plate holder onto the plate sorting arm, and bring the arm to the home position (Figure 2B). Test sort a droplet and check its position on top of the lid; it should be dead center (Figure 2B). Adjust the position of the plate if necessary and save the new home position.
Add 5 μL of 2× Reaction Mix from the Cells Direct PCR kit per tube of the PCR strip. Prepare the number of tubes required for your experiment (in our case, six), cut off the remaining tubes from the PCR strip with scissors, and discard them. Position the PCR strip (with open lid!) into the holder on the plate sorting arm (Figure 2C).
Sort 500 cells of the first single-cell suspension into the first tube, making the volume in that sample tube 6 μL (5 μL of 2× Reaction Mix + 1 μL of sorted cells) (Figure 2D). Unload the sample, flush the sample- line, and load the next sample. Sort 500 cells into the next tube. Proceed until all tubes have received 500 cells. Here, we sorted 500 MuSCs from the gastrocnemius and masseter muscles from three mice.
Notes:
The CellsDirect Reaction Mix kit can be used for a maximum of 1,000 cells. Depending on the mRNA content of the cell, more or fewer cells can be used as input with a maximum of 1,000 cells. We recommend confirming sorting efficiency by sorting 500 cells into a coated well of a 96-well plate and counting the cell number using microscopy.
The 2× Reaction Mix is one of the components of the CellsDirect One Step qRT-PCR kit. It consists of dNTPs, reaction buffer, and magnesium sulphate, which supports the activity of the polymerase enzyme.
Close the lids on the PCR strip, vortex, and spin down immediately in a mini centrifuge. The samples can be kept on ice to be used immediately or stored at -20 °C for short term (1–2 weeks) or at -80 °C for long term (6–8 months).
Note: The lower the temperature, the higher the stability of the mRNA collected in the sample tubes (Jaquet et al., 2022).
CRITICAL STEP: Vortex the sample tubes thoroughly to mix the sample components and spin them down in a mini centrifuge before storage.
Reverse transcriptase-polymerase reaction
CRITICAL STEP: To prevent RNase contamination, this section of the protocol is carried out under sterile and RNase-free conditions. Wear gloves and spray down the workspace with 70% EtOH. Further, all the steps are performed on ice to improve RNA stability. The chemical RNaseZapis recommended to clean the bench to prevent RNase contamination.
CRITICAL STEP: The contents of the CellsDirect Reaction mix need to be thawed on ice before use and all the steps need to be performed in ice.
Thaw the TaqMan probes and the remaining additives (DEPC-treated water, TaqMan probes, resuspension buffer, SuperScriptTMIII RT/PlatinumTMTaq Mix, and the ROX reference dye) of the CellsDirect kit.
Prepare a master mix (CellsDirect Reaction mix) for all your sample tubes (in our experiment, six tubes: three sample tubes with MuSCs sorted from gastrocnemius muscle and three sample tubes with MuSCs sorted from masseter muscle).
For six sample tubes, the mix is prepared by adding 24 μL of resuspension buffer, 1.2 μL of SuperScriptTMIII RT/PlatinumTMTaq Mix, 1.2 μL of TaqMan probe sets (for forward and reverse primer, respectively, making the final volume of each set 2.4 μL), 2.3 μL of DEPC-treated water, and 0.1 μL of ROX reference dye to a RNase-free 1.5 mL Eppendorf tube. Here, we use TaqMan probes for Pax3total and Pax3long (each targeting individual sequences in the Pax3 mRNA).
Notes:
The Pax3long TaqMan probe set hybridizes to a site that is present only in long isoform of Pax3, while the Pax3total TaqMan probe set hybridizes to a site that is present in both long and short isoforms of Pax3 (Figure 2), each generating different amplicons of Pax3 reflecting different sites of the transcript.
We recommend always preparing the master mix for n samples + 1 to ensure that there is sufficient volume for pipetting.
Retrieve the PCR strip containing the lysed cells in CellsDirect 2× on ice. If the cells were stored and frozen previously, then thaw on ice.
Add 4 μL of the CellsDirect Reaction mix (master mix), making the final volume in each sample tube 10 μL. Vortex and spin the tubes down in a mini centrifuge and immediately transfer the tubes to ice after they have been spun down. CRITICAL STEP: Vortexing the sample tubes helps to evenly distribute the molecules in the tube. This is an important step to ensure that the molecules in the reaction volume are homogeneously distributed. However, it must be followed with a centrifugation step to pool all the reaction volume at the bottom of the tube.
Place the sample tubes in the thermal cycler and close the machine.
Run the reverse transcriptase-polymerase reaction (see step A1 for the program).
After the reverse transcriptase program is completed, place the tubes containing the cDNA (10 μL of total volume) on ice. Briefly spin down the samples in a mini centrifuge and add 1.2 μL of 10× ExoI buffer and 1 μL of exonuclease I into each of the tubes for a total volume of 12.2 μL per tube (in our case, six sample tubes). Vortex and spin the tubes down in a mini centrifuge and immediately transfer the tubes to ice after they have been spun down.
Note: The exonuclease buffer facilitates the activity of the exonuclease, which digests the single-stranded DNA, including all the non-hybridized TaqMan probes. This step ensures that these non-hybridized probes do not interfere with the downstream TaqMan detections: Pax3total and Pax3long during mdPCR.
Place the sample tubes back in the thermal cycler, close the machine, and run the exonuclease program (see step A2 for the program)
Once the exonuclease program has completed, immediately place the tubes containing the double-stranded cDNA back on ice.
The samples can be used immediately or stored at -20 °C for short term (1–2 weeks) or at -80 °C for long term (6–8 months) storage.
Priming the 12.765 Digital ArrayTMIntegrated Fluidic Circuit (IFC)
The following steps adhere to the manufacturer’s protocol.
CRITICAL STEP: This section of the protocol is performed under sterile conditions. Wear gloves and avoid working above the microfluidic chip to prevent any fluid from dropping on top of the chip, which might affect the accurate detection of gene expression.
CRITICAL STEP: Switch on the IFC Controller MX machine. It takes 10 min to warm up.
Unwrap the microfluidic chip. Avoid touching the center of the chip. Any pressure will damage the microfluidic channels. An unwrapped chip has to be used within 24 h.
Note: This protocol can be performed using other digital PCR chips by Fluidigm.
Inject the control line fluid in each of the accumulators on the chip by pushing down the black O-ring. Beware not to splash any of the oily control line fluid.
Note: In order to facilitate easy flow of the liquid and to avoid air bubbles, inject the control line fluid into each of the accumulators at an angle of 45 degrees. The fluid prevents evaporation of the sample and helps to seal the chip.
Insert the chip into the IFC Controller.
Run the Prime (115×) script to prime the chip by dispersing the oil. It takes approximately 20 min to run the script.CRITICAL STEP: Once primed, the chip must be loaded within an hour to prevent the microfluidic chambers from collapsing.
Preparing the sample pre-mix for Digital PCR
CRITICAL STEP: This section of the protocol is carried out under sterile and RNase-free conditions. Wear gloves and spray down the workspace with 70% EtOH.
Prepare a master mix for each target mRNA isoform. Prepare a master mix A for six samples, consisting of 18 μL of DNA-free water, 30 μL of TaqMan Gene Expression Master Mix, 3 μL of 20× GE Sample Loading Reagent, and 1.5 μL of the Pax3long TaqMan probe in a 1.5 mL Eppendorf tube. Each TaqMan probe consists of the forward, reverse, and middle primer.
Prepare a master mix B for six samples, consisting of 18 μL of DNA-free water, 30 μL of TaqMan Gene Expression Master Mix, 3 μL of 20× GE Sample Loading Reagent, and 1.5 μL of Pax3total TaqMan probe in a 1.5 mL Eppendorf tube.
Prepare two PCR tube strips. Add 9 μL of master mix A to the first six sample tubes of the first PCR tube strip and 9 μL of master mix B into the first six sample tubes of the second PCR tube strip.
Add 1 μL of the cDNA from step C10 into each of the PCR-sample tubes containing master mix A and master mix B, bringing the final volume to 10 μL.
Vortex the PCR sample tubes and spin them down in a mini centrifuge. Place them immediately on ice.CRITICAL STEP: Vortexing the sample tubes helps to evenly distribute the molecules in the tube. This is an important step to ensure that the samples in the chip are homogeneous.
Loading the samples onto the chip
CRITICAL STEP: Wear gloves and spray down the workspace with 70% EtOH to avoid contamination.
Remove the primed chip from the IFC Controller MX once the priming program has finished.
Add 8 μL of DNA-free water into each of the H inlets. Pipette 8 μL from each sample tube to the individual wells.CRITICAL STEP: Load the samples directly into the wells and avoid going above the chip to prevent cross-contamination. To prevent bubbles while loading the sample, only pipette until the first resistance on the pipette.
Return the chip to the IFC Controller MX and select the Load (115×) script to load the samples into the chip. It takes approximately 45 min to load the samples onto the chip.
Note: Always make sure that the correct script is selected before running the software.
Switch on the Fluidigm Biomark HD Real-Time PCR machine while the chip load program is running.
Note: The Fluidigm Biomark HD Real-Time PCR machine needs to be switched on prior to use so that the CCD camera can cool down to the optimum temperature (-5 °C).
Real-time PCR
After the samples are loaded, remove the chip from the IFC Controller MX.
Insert the chip into the Fluidigm Biomark HD Real-Time PCR in a direction in which the barcode is facing outside and click Load.
CRITICAL STEP: When putting the chip into the drawer of the BioMark HD, slowly remove the protective sticker from underneath the chip. Removal is required for any light to pass through the chip during the amplification reaction.
Once the samples are loaded onto the chip, open the data collection software icon on the desktop connected to the Fluidigm Biomark HD Real-Time PCR.
Click on the option Start a New Run.
CRITICAL STEP: Double-check if the status bar on the software shows that both the camera and lamp are green before loading the chip into the machine. The icons will both be green if they are ready. Otherwise, wait until the temperature calibration is completed.
Once the system reads the barcode on the chip, verify the barcode and the chip type on the software.
Next, select the chip run file to run the program. Enter the chip information and save it before proceeding to the next step.
Select the specific application type (Digital PCR), reference dye (ROX), and the assay probes. Select the probe types and click next.
Click on the dPCR Standard v1.pcl protocol and start the run. A standard run takes approximately 1.5 h.
Result analysis using the Digital PCR Analysis Software
Select the Digital PCR Analysis software icon on the software and click on it once the run is completed.
To open the specific chip run file, click on the Open a Chip Run option and double-click on the chiprun.bml file to open it in the software.
Under the Sample and Detector setup option in the Chip explorer plane, highlight and annotate your wells (we named our samples as GA1, GA2, and GA3 and Mass1, Mass2, and Mass3) under the Sample Type option from the drop-down menu in the Editor.
Next, choose the Detector Type from the same menu and name them as Pax3total and Pax3long.
Click on the Update option to finalize the changes made. For the data analysis to begin, click on the Analyze option.
Note: The software has three ways of baseline correction. It is recommended to test all three methods and evaluate the appearance of the signal curves, which should be S-shaped. We recommend using the Constant baseline correction.
Click Analyze.
Once the analysis is done, click on the Panel Summary or Panel Details to view the result sheet in the form of table, image, or a heatmap.
Export all the files with the .csv extension.
Data analysis
We isolated MuSCs from the gastrocnemius and masseter muscles from three wildtype C57/BL6 mice that were discontinued from a local breeding program. The muscles were digested using collagenase II and dispase, followed by staining and preparation for sorting (Frimand et al., 2022). From the stained single-cell suspensions, 500 MuSCs were then sorted using a BD ARIA III FACS directly into sample tubes in a PCR tube strip containing 2× reaction mix (a total of six tubes: three each of gastrocnemius and masseter). The accuracy of the sort was confirmed by sorting an additional 500 cells into a collagen-coated well in a 96-wells plate and counting the cells by microscopy after staining with Hoechst (Figure 3A). Following the extraction and single step amplification of cDNA using reverse transcriptase polymerase reaction, mdPCR was performed using TaqMan probes for Pax3total and Pax3long (Figure 3B–3D). The numbers of Pax3total and Pax3long transcripts on average per MuSC can be calculated using the equation 1 below. The numbers of Pax3total transcripts were 3.87 (± 1.93) and 17.24 (± 0.57) on average per MuSC for gastrocnemius and masseter, respectively. The numbers of Pax3long transcripts were 3.6 (± 0.97) and 2.8 (± 1.81) on average per MuSC for gastrocnemius and masseter (Figure 3E). The numbers of Pax3short transcripts as calculated from equation 2 were 0.25 (± 0.25) and 14.5 (± 2.21) on average per MuSC for gastrocnemius and masseter, respectively. The results from mdPCR can be validated using single molecule RNA fluorescent in situ hybridization (Gaspar and Ephrussi, 2015; de Morrée et al., 2017; de Morree et al., 2019).
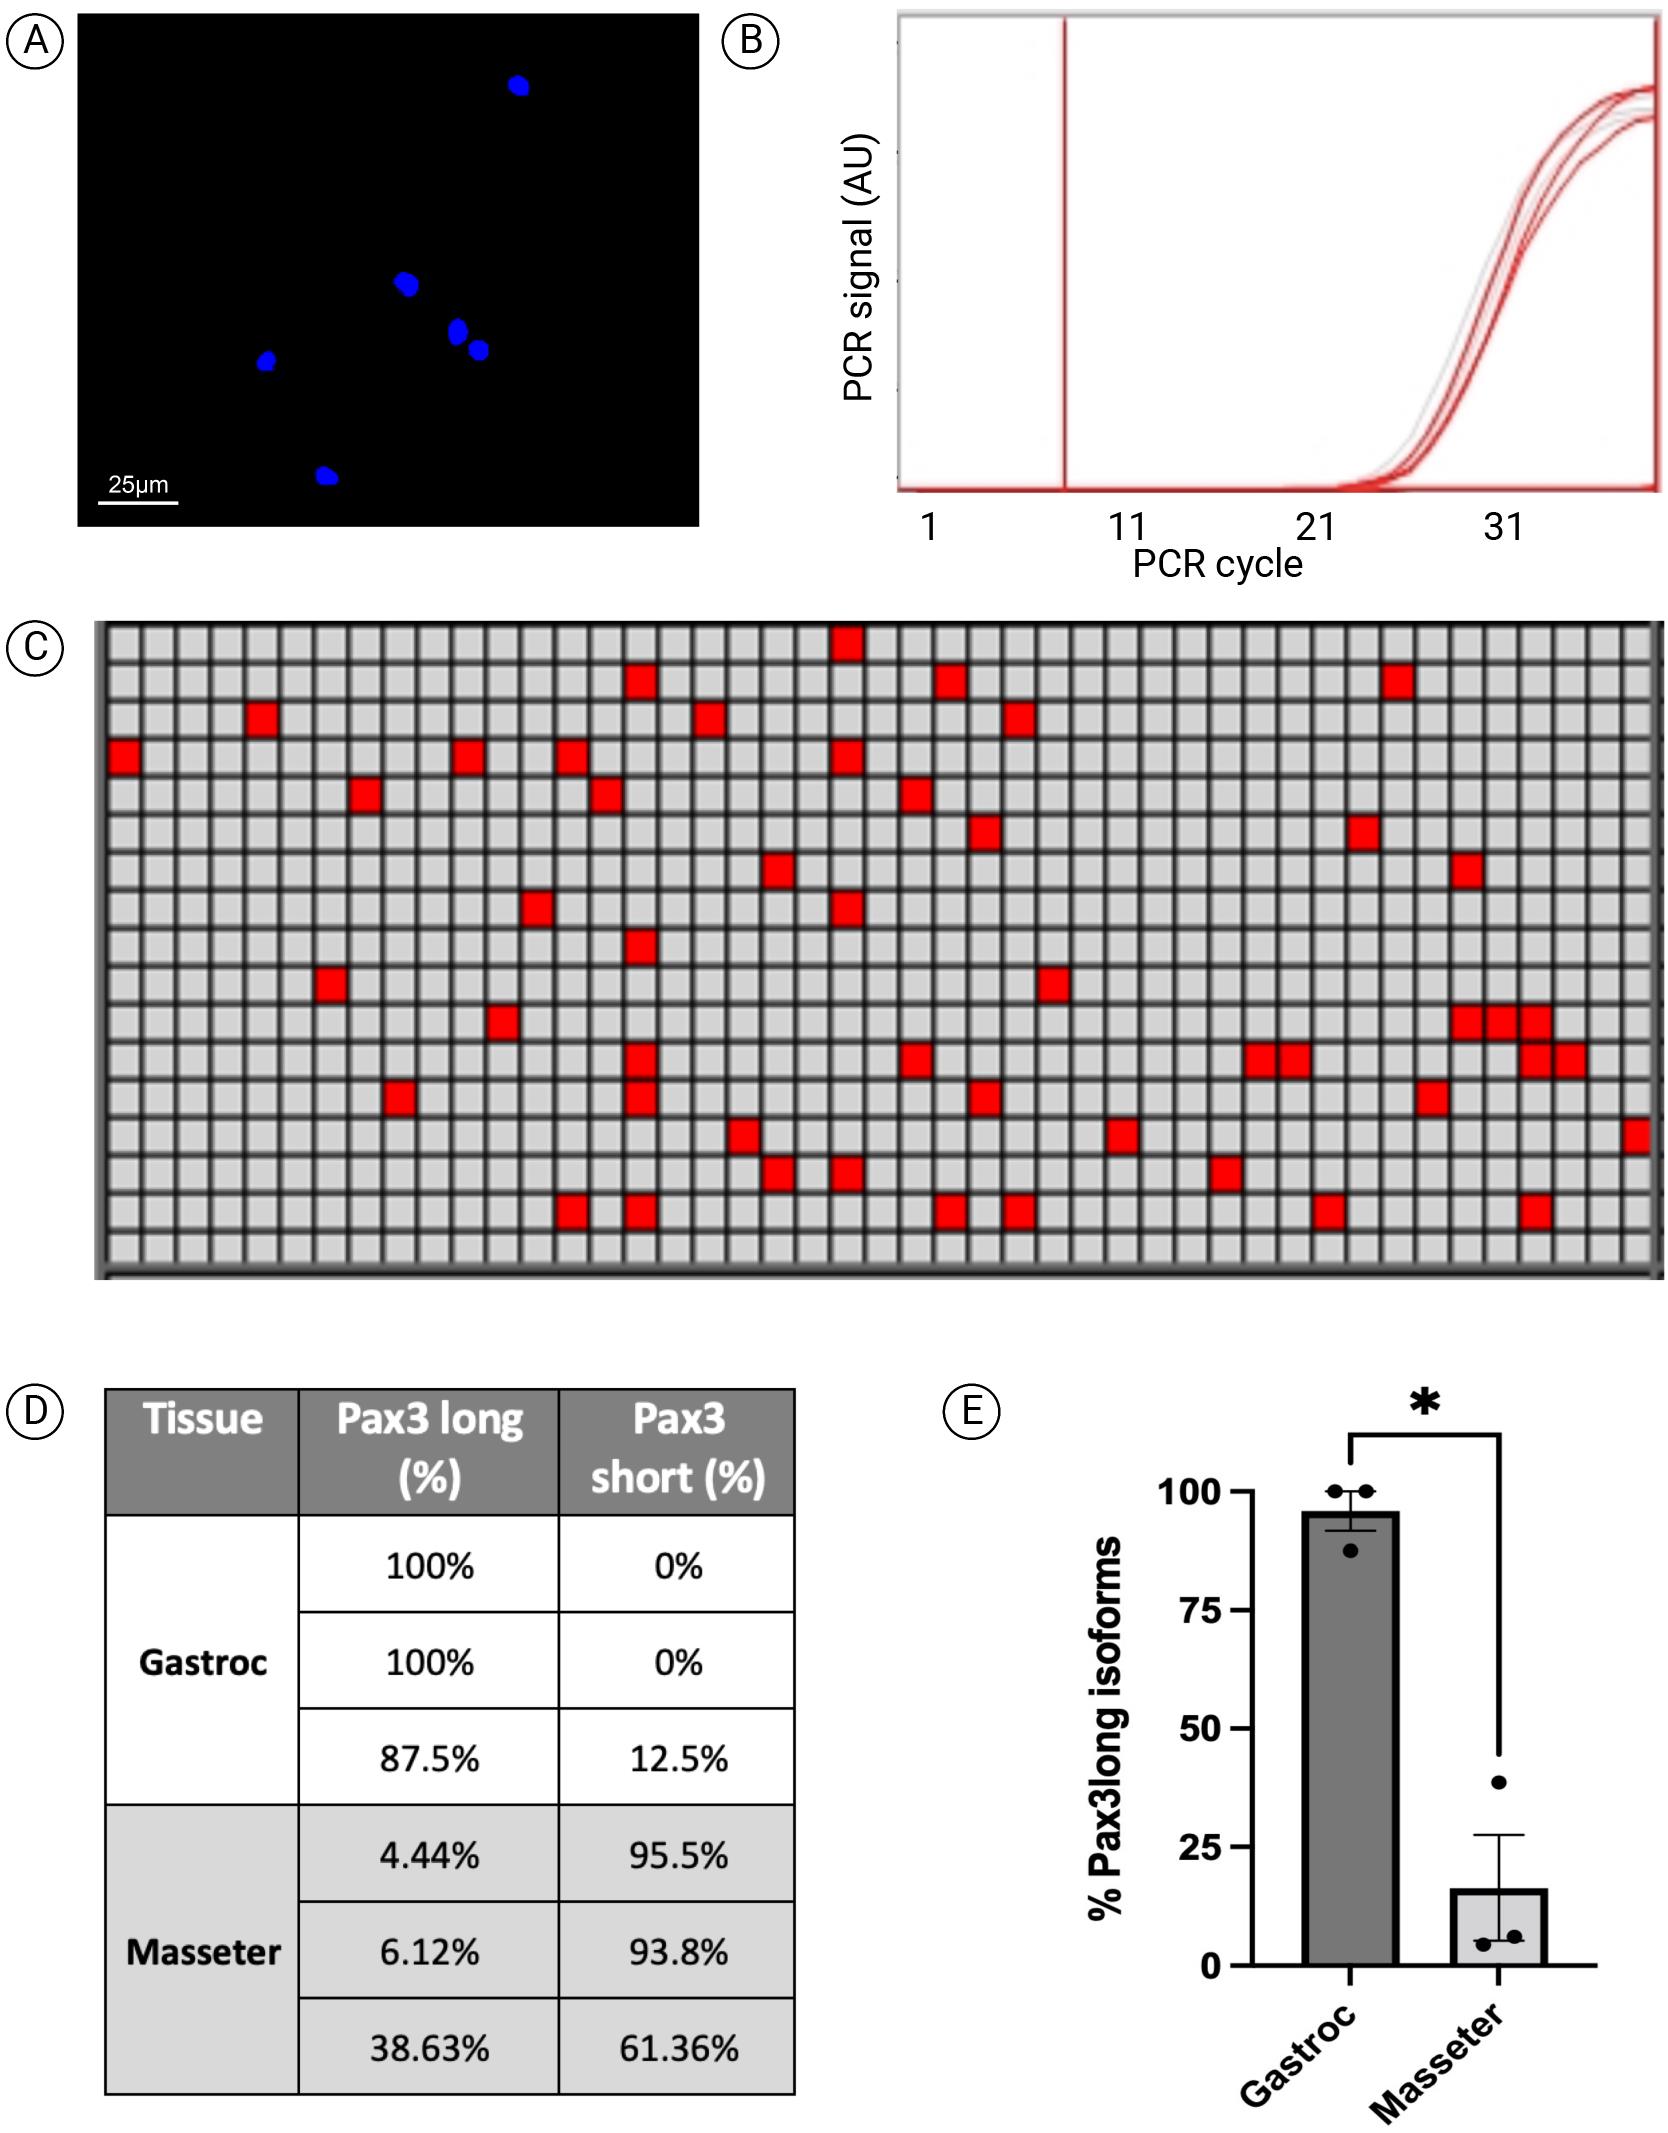
Figure 3. Absolute quantification of Pax3 mRNA isoforms in muscle stem cells (MuSCs) using microfluidic digital PCR (mdPCR). (A) Hoechst-stained cells (500 cells) sorted into a collagen-coated well of a 96-well half bottom plate to verify sorting efficiency. One 20× field is shown. (B) PCR amplification graph of Pax3total mRNA isoforms on one sample of gastrocnemius MuSC cDNA. (C) Heatmap of the mdPCR results of Pax3total detection of gastrocnemius MuSC cDNA. The red boxes denote nanochambers in which a signal was amplified. (D) Table representing the relative abundance of Pax3long and Pax3short isoforms in MuSCs isolated from gastrocnemius and masseter muscles (n = 3). (E) Graph depicting the relative amount of Pax3long isoforms as a percentage of total Pax3 mRNA transcripts in MuSCs isolated from gastrocnemius and masseter muscles (n = 3, *= p < 0.05, unpaired two-tailed Student’s t-test).
Equation 1: Calculating the mean number of molecules per cell
(Vloading× Vcellsdirect)/(Vchamber× Nchambers)/Ncells= X molecules per cell
Vloadingis the loading volume for the chip (in this protocol, 10 μL, see step C4);
Vcellsdirectis the volume of the initial cDNA reaction (in this protocol, 12.2 μL, see step C7);
Vchamberis the volume of one nanochamber (for this chip, 0.85 nL);
Nchambersis the total number of nanochambers used for a sample (for this chip, 765);
Ncellsis the number of cells added to the cDNA synthesis reaction (in our experiment, 500);
X is the number of positive nanochambers.
(10 μL × 12.2 μL)/(0.85 nL × 765)/500 = 0.375X
Each chamber has a 0.85 nL volume. Each sample is spread over 765 chambers (in the case of a 12.765 chip) with a combined volume of 0.65 μL. In that volume, we detected X number of positive chambers that contained one molecule. X number of positive chambers multiplied by (10 μL/0.65 μL = 12.3) is 15.4X molecules per loading mix and thus per 1 μL of sample. Multiply 15.4X by 12.2 μL to get the total molecules per sample at 187.7X. Divide 150.1X by 500 cells to get 0.375 times X molecules per cell. Fill in the number of positive nanochambers for X to get the number of transcripts per cell.
Equation 2: Calculating isoform abundance
Calculation:
Xpax3total - Xpax3long = Xpax3short molecules per cell
Xpax3total is the number of detected Pax3total molecules per cell. Xpax3long is the number of detected Pax3long molecules per cell. Xpax3short is the number of calculated Pax3short molecules per cell.
General notes and troubleshooting
General notes
This protocol allows for the absolute quantification of mRNA isoforms, as demonstrated by our measurements of isoforms in quiescent MuSCs. The TaqMan probes selected are designed to specifically anneal to the site of interest (Pax3total targeting both short and long isoforms and Pax3long targeting the Pax3long isoforms). During the extension phase of each polymerase reaction in the mdPCR chip, the 5′ nuclease activity of the enzyme will cleave the 5′ reporter dye from the perfectly hybridized probe, resulting in increased fluorescence or signal (Liu et al., 2013). This protocol allows a precise calculation of the number of Pax3long and Pax3short transcripts per MuSC. It can also be used to detect other types of mRNA isoforms, including alternative splicing isoforms and alternative 5′ UTR isoforms.
TaqMan Digital PCR works on the TaqMan Probe-based Assay chemistry. There are alternative ways of detecting amplified PCR products that are based on EVA Green Dye based chemistry (McDermott et al., 2013). However, this dye might target non-specific sequences of double-stranded DNA (Mao et al., 2007). In contrast, the TaqMan-based assay is highly specific because it requires specific hybridization between the three probes and the target to initiate fluorescent signals (Liu et al., 2018).
This protocol is cost effective due to the low amount of reagents required to run the protocol (Mao et al., 2019). However, mdPCR chips are expensive and for single-time use. The cellular limit of the CellsDirect Reaction Mix is also restricted, which means that when RNA content exceeds the limit, not all can be converted into cDNA. This could lead to an incorrect assessment of the number of molecules detected. In order to prevent this, use a maximum of 500 cells as input for the CellsDirect kit. To ensure that the number of molecules detected is accurate, it is also important to vortex all the sample tubes thoroughly in order to homogenize the samples before loading it on the chip. This can also be ensured by increasing the volume of cDNA used for the sample mix.
Acknowledgments
Cell sorting was performed at the FACS Core Facility, Aarhus University, Denmark. Figures were created using Biorender.com. We thank Dr. Line Reinert, Aarhus University, for assistance with the BioMark HD. This work was supported by a Start Package grant (0071116) and a Project Grant (0080556) from NovoNordiskFonden to A.D.M. This protocol was applied and validated in a previous publication (de Morree et al., 2019).
Competing interests
The authors have no competing financial interests and no conflicts of interest.
Ethics considerations
The protocol was performed in accordance with animal care guidelines at Aarhus University and local ethics regulations.
References
- Boutet, S. C., Cheung, T. H., Quach, N. L., Liu, L., Prescott, S. L., Edalati, A., Iori, K. and Rando, T. A. (2012). Alternative Polyadenylation Mediates MicroRNA Regulation of Muscle Stem Cell Function. Cell Stem Cell 10(3): 327–336.
- Brett, J. O., Arjona, M., Ikeda, M., Quarta, M., de Morrée, A., Egner, I. M., Perandini, L. A., Ishak, H. D., Goshayeshi, A., Benjamin, D. I., et al. (2020). Exercise rejuvenates quiescent skeletal muscle stem cells in old mice through restoration of Cyclin D1. Nat. Metab. 2(4): 307–317.
- de Morree, A. and Rando, T. A. (2023). Regulation of adult stem cell quiescence and its functions in the maintenance of tissue integrity. Nat. Rev. Mol. Cell Biol. 24(5): 334–354.
- de Morree, A., Klein, J. D. D., Gan, Q., Farup, J., Urtasun, A., Kanugovi, A., Bilen, B., van Velthoven, C. T. J., Quarta, M., Rando, T. A., et al. (2019). Alternative polyadenylation of Pax3 controls muscle stem cell fate and muscle function. Science 366(6466): 734–738.
- de Morrée, A., van Velthoven, C. T. J., Gan, Q., Salvi, J. S., Klein, J. D. D., Akimenko, I., Quarta, M., Biressi, S. and Rando, T. A. (2017). Staufen1 inhibits MyoD translation to actively maintain muscle stem cell quiescence. Proc. Natl. Acad. Sci. U. S. A. 114(43): e1708725114.
- Emslie, K. R., H. McLaughlin, J. L., Griffiths, K., Forbes-Smith, M., Pinheiro, L. B. and Burke, D. G. (2019). Droplet Volume Variability and Impact on Digital PCR Copy Number Concentration Measurements. Anal. Chem. 91(6): 4124–4131.
- Frimand, Z., Das Barman, S., Kjær, T. R., Porpiglia, E. and de Morrée, A. (2022). Isolation of Quiescent Stem Cell Populations from Individual Skeletal Muscles. J. Visualized Exp.: e3791/64557.
- Gaspar, I. and Ephrussi, A. (2015). Strength in numbers: quantitative single-molecule RNA detection assays. Wiley Interdiscip. Rev.: Dev. Biol. 4(2): 135–150.
- Hindson, C. M., Chevillet, J. R., Briggs, H. A., Gallichotte, E. N., Ruf, I. K., Hindson, B. J., Vessella, R. L. and Tewari, M. (2013). Absolute quantification by droplet digital PCR versus analog real-time PCR. Nat. Methods 10(10): 1003–1005.
- Jaquet, V., Wallerich, S., Voegeli, S., Túrós, D., Viloria, E. C. and Becskei, A. (2022). Determinants of the temperature adaptation of mRNA degradation. Nucleic Acids Res. 50(2): 1092–1110.
- Joe, A. W. B., Yi, L., Natarajan, A., Le Grand, F., So, L., Wang, J., Rudnicki, M. A. and Rossi, F. M. V. (2010). Muscle injury activates resident fibro/adipogenic progenitors that facilitate myogenesis. Nat. Cell Biol. 12(2): 153–163.
- Kozera, B. and Rapacz, M. (2013). Reference genes in real-time PCR. J. Appl. Genet. 54(4): 391–406.
- Liu, C. F., Shi, X. P., Chen, Y., Jin, Y. and Zhang, B. (2018). Rapid diagnosis of sepsis with TaqMan-Based multiplex real-time PCR. J. Clin. Lab. Anal. 32(2): e22256.
- Liu, J., Gratz, J., Amour, C., Kibiki, G., Becker, S., Janaki, L., Verweij, J. J., Taniuchi, M., Sobuz, S. U., Haque, R., et al. (2013). A Laboratory-Developed TaqMan Array Card for Simultaneous Detection of 19 Enteropathogens. J. Clin. Microbiol. 51(2): 472–480.
- Mao, F., Leung, W. Y. and Xin, X. (2007). Characterization of EvaGreen and the implication of its physicochemical properties for qPCR applications. BMC Biotech. 7(1): e1186/1472-6750-7-76.
- Mao, X., Liu, C., Tong, H., Chen, Y. and Liu, K. (2019). Principles of digital PCR and its applications in current obstetrical and gynecological diseases. Am. J. Transl. Res. 11(12): 7209–7222.
- McDermott, G. P., Do, D., Litterst, C. M., Maar, D., Hindson, C. M., Steenblock, E. R., Legler, T. C., Jouvenot, Y., Marrs, S. H., Bemis, A., et al. (2013). Multiplexed Target Detection Using DNA-Binding Dye Chemistry in Droplet Digital PCR. Anal. Chem. 85(23): 11619–11627.
- Nolan, T., Hands, R. E. and Bustin, S. A. (2006). Quantification of mRNA using real-time RT-PCR. Nat. Protoc. 1(3): 1559–1582.
- Relaix, F., Bencze, M., Borok, M. J., Der Vartanian, A., Gattazzo, F., Mademtzoglou, D., Perez-Diaz, S., Prola, A., Reyes-Fernandez, P. C., Rotini, A., et al. (2021). Perspectives on skeletal muscle stem cells. Nat. Commun. 12(1): e1038/s41467-020-20760-6.
- Relaix, F., Rocancourt, D., Mansouri, A. and Buckingham, M. (2005). A Pax3/Pax7-dependent population of skeletal muscle progenitor cells. Nature 435(7044): 948–953.
- Rodgers, J. T., King, K. Y., Brett, J. O., Cromie, M. J., Charville, G. W., Maguire, K. K., Brunson, C., Mastey, N., Liu, L., Tsai, C. R., et al. (2014). mTORC1 controls the adaptive transition of quiescent stem cells from G0 to GAlert. Nature 510(7505): 393–396.
- Uezumi, A., Fukada, S. i., Yamamoto, N., Takeda, S. and Tsuchida, K. (2010). Mesenchymal progenitors distinct from satellite cells contribute to ectopic fat cell formation in skeletal muscle. Nat. Cell Biol. 12(2): 143–152.
- Verheul, R. C., van Deutekom, J. C. T. and Datson, N. A. (2016). Digital Droplet PCR for the Absolute Quantification of Exon Skipping Induced by Antisense Oligonucleotides in (Pre-)Clinical Development for Duchenne Muscular Dystrophy. PLoS One 11(9): e0162467.
- Yin, H., Price, F. and Rudnicki, M. A. (2013). Satellite Cells and the Muscle Stem Cell Niche. Physiol. Rev. 93(1): 23–67.
Article Information
Publication history
Published: Sep 5, 2023
Copyright
© 2023 The Author(s); This is an open access article under the CC BY-NC license (https://creativecommons.org/licenses/by-nc/4.0/).
How to cite
Readers should cite both the Bio-protocol article and the original research article where this protocol was used:
- Das Barman, S., Frimand, Z. and De Morree, A. (2023). Absolute Quantification of mRNA Isoforms in Adult Stem Cells Using Microfluidic Digital PCR. Bio-protocol 13(17): e4811. DOI: 10.21769/BioProtoc.4811.
- de Morree, A., Klein, J. D. D., Gan, Q., Farup, J., Urtasun, A., Kanugovi, A., Bilen, B., van Velthoven, C. T. J., Quarta, M., Rando, T. A., et al. (2019). Alternative polyadenylation of Pax3 controls muscle stem cell fate and muscle function. Science 366(6466): 734–738.
Category
Stem Cell > Adult stem cell > Muscle stem cell
Do you have any questions about this protocol?
Post your question to gather feedback from the community. We will also invite the authors of this article to respond.
![]() Tips for asking effective questions
Tips for asking effective questions
+ Description
Write a detailed description. Include all information that will help others answer your question including experimental processes, conditions, and relevant images.