
- Submit a Protocol
- Receive Our Alerts
- EN

- Protocols

- Articles and Issues
- For Authors
- About
- Become a Reviewer

Cell Cycle Analysis of Candida albicans by Flow Cytometry
(*contributed equally to this work) Published: Vol 13, Iss 20, Oct 20, 2023 DOI: 10.21769/BioProtoc.4848 Views: 343
Reviewed by: Alba BlesaAnonymous reviewer(s)
Original research article
The authors used this protocol in:

Jan 2023

Protocol Collections
Comprehensive collections of detailed, peer-reviewed protocols focusing on specific topics
Related protocols
Abstract
The cell cycle is a vital process of cell division that is required to sustain life. Since faithful cell division is critical for the proper growth and development of an organism, the study of the cell cycle becomes a fundamental research objective. Saccharomyces cerevisiae has been an excellent unicellular system for unraveling the secrets of cell division, and the process of synchronization in budding yeast has been standardized. Cell synchronization is a crucial step of cell cycle analysis, where cells in a culture at different stages of the cell cycle are arrested to the same phase and, upon release, they progress synchronously. The cellular synchronization of S. cerevisiae is easily achieved by a pheromone or other chemicals like hydroxyurea treatment; however, such methodologies seem to be ineffective in synchronizing cells of multimorphic fungi such as Candida albicans. C. albicans is a human pathogen that can grow in yeast, pseudohyphal, and hyphal forms; these forms differ in morphology as well as cell cycle progression. More importantly, upon subjecting to DNA replication inhibitors for synchronization, C. albicans develops hyphal structures and grows asynchronously. Therefore, here we describe a simple and easy method to synchronize C. albicans cells in the G1 phase and the subsequent analysis of cell cycle progression by using flow cytometry.
Keywords: Cell synchronizationBackground
Cell cycle is a multievent cellular process that plays an essential role in maintaining genome stability by coordinating processes like DNA replication, DNA damage repair, and chromosome segregation during cell division. The whole cycle is completed in four phases, where DNA replication is confined to the S phase, G1 is the gap between the M phase and S phase, G2 is the gap between the S phase and M phase, and the division of the nucleus followed by the cytoplasm is restricted to the M phase (Figure 1). G1 and G2 phases are known for cell growth, metabolic activity, and for preparing for the next phase of the cell cycle (Hartwell et al., 1974). When the cells are proliferating, they can be at any phase of the cell cycle; therefore, to properly explore the mechanism of cell cycle progression, synchronization of a heterogeneous population of cells becomes critical. In human cells, serum starvation and double thymidine block are commonly used approaches for synchronizing a cell population (Ma and Poon, 2017). Saccharomyces cerevisiae cells can be synchronized in the G1 phase of the cell cycle with the mating pheromone, α-factor. Similarly, hydroxyurea and nocodazole synchronize budding yeast cells in the early S phase and G2/M phase, respectively (Rosebrock, 2017).
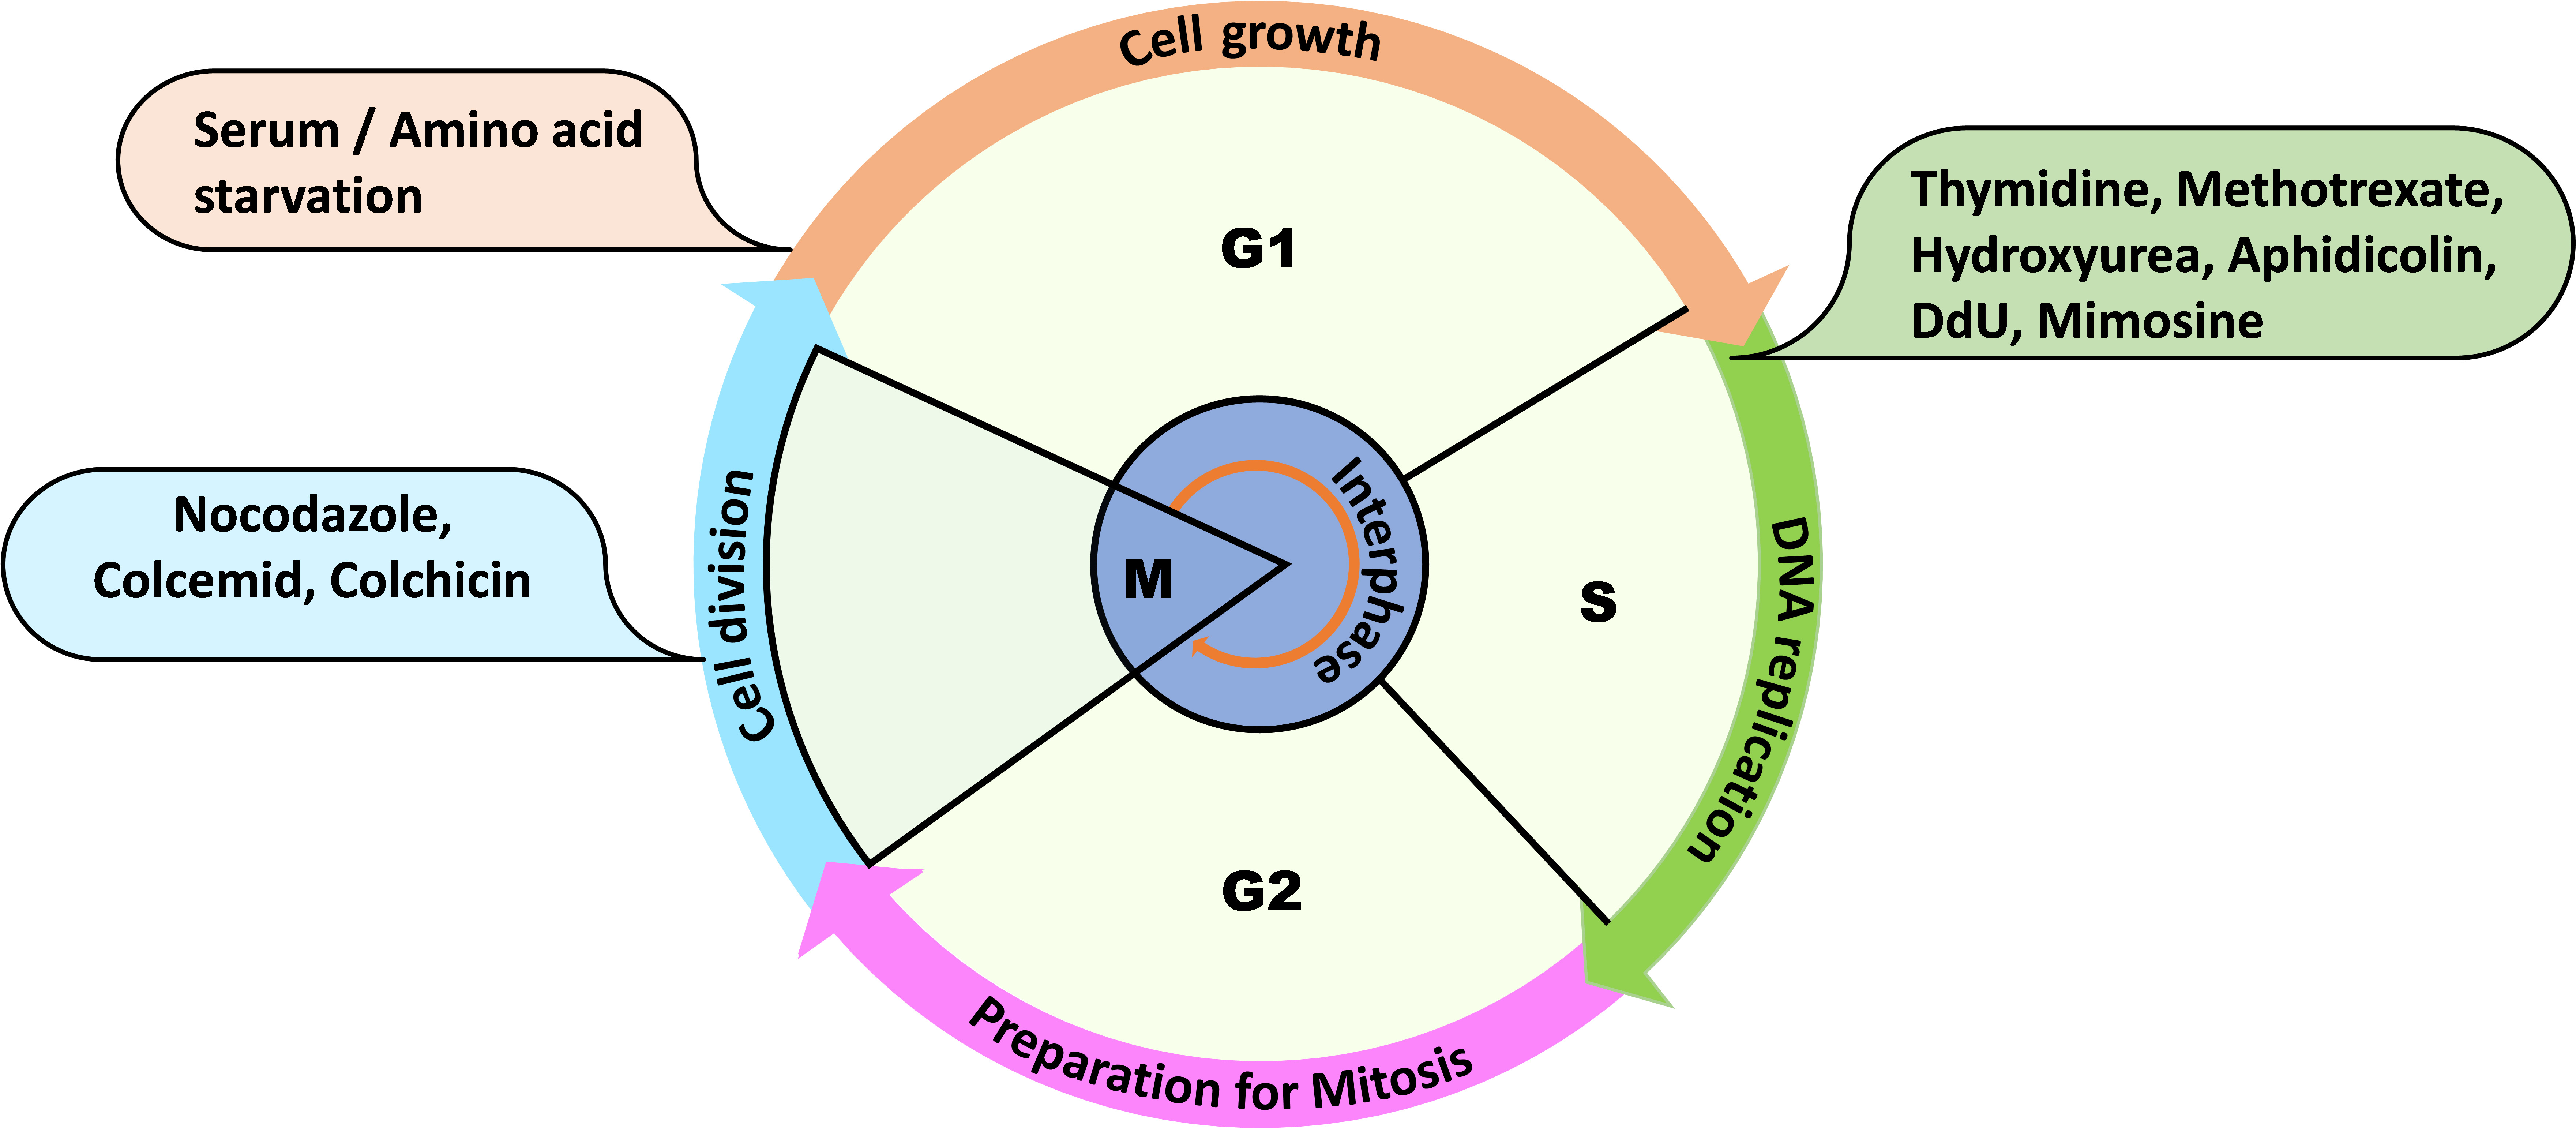
Figure 1. Overview of the cell cycle phases and some routinely used reagents for cell synchronization at the mentioned phases of the cell cycle. For example: thymidine, methotrexate, hydroxyurea, aphidicolin, dedoxy uridine, and mimosine are used to synchronize the cells at G1 or early S phase.
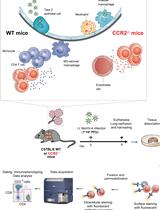
Upon releasing these synchronized cells into a fresh medium, cells undergo similar cell cycle progression that can be monitored after collecting cell populations at different time points. DNA content measurement of a cell population by using DNA-binding fluorescent dyes and a flow cytometer is one of the reliable techniques for getting insights into the cell cycle dynamics of an organism (Haase and Reed, 2002). The existing methodologies of cell synchronization do not work effectively in the case of fungi like Candida albicans. C. albicans is a gut pathogen that survives in at least three morphological forms: yeast, pseudohyphae, and hyphae. Interestingly, these cell types differ even in the rate and order of cell cycle events (Berman, 2006). In addition, most of these reagents used to synchronize cells also induce filamentation in C. albicans (Manohar et al., 2018; Kumari et al., 2023; Patel et al., 2023). Therefore, cell synchronization is one of the major challenges for exploring the cell cycle in C. albicans. Additionally, the use of external chemical reagents for cell synchronization may affect the native cellular physiology by inducing stress in the cells, which will never be a true estimation of the cell cycle and end up in erroneous cell cycle analyses. Therefore, here we describe and demonstrate a chemical method/approach where a time-point-based incubation results in > 90% cell synchronization at the G1 phase so that the cell cycle analysis can be executed without hampering the native physiology of the cells (Figure 2 and Supplementary Figure 1).
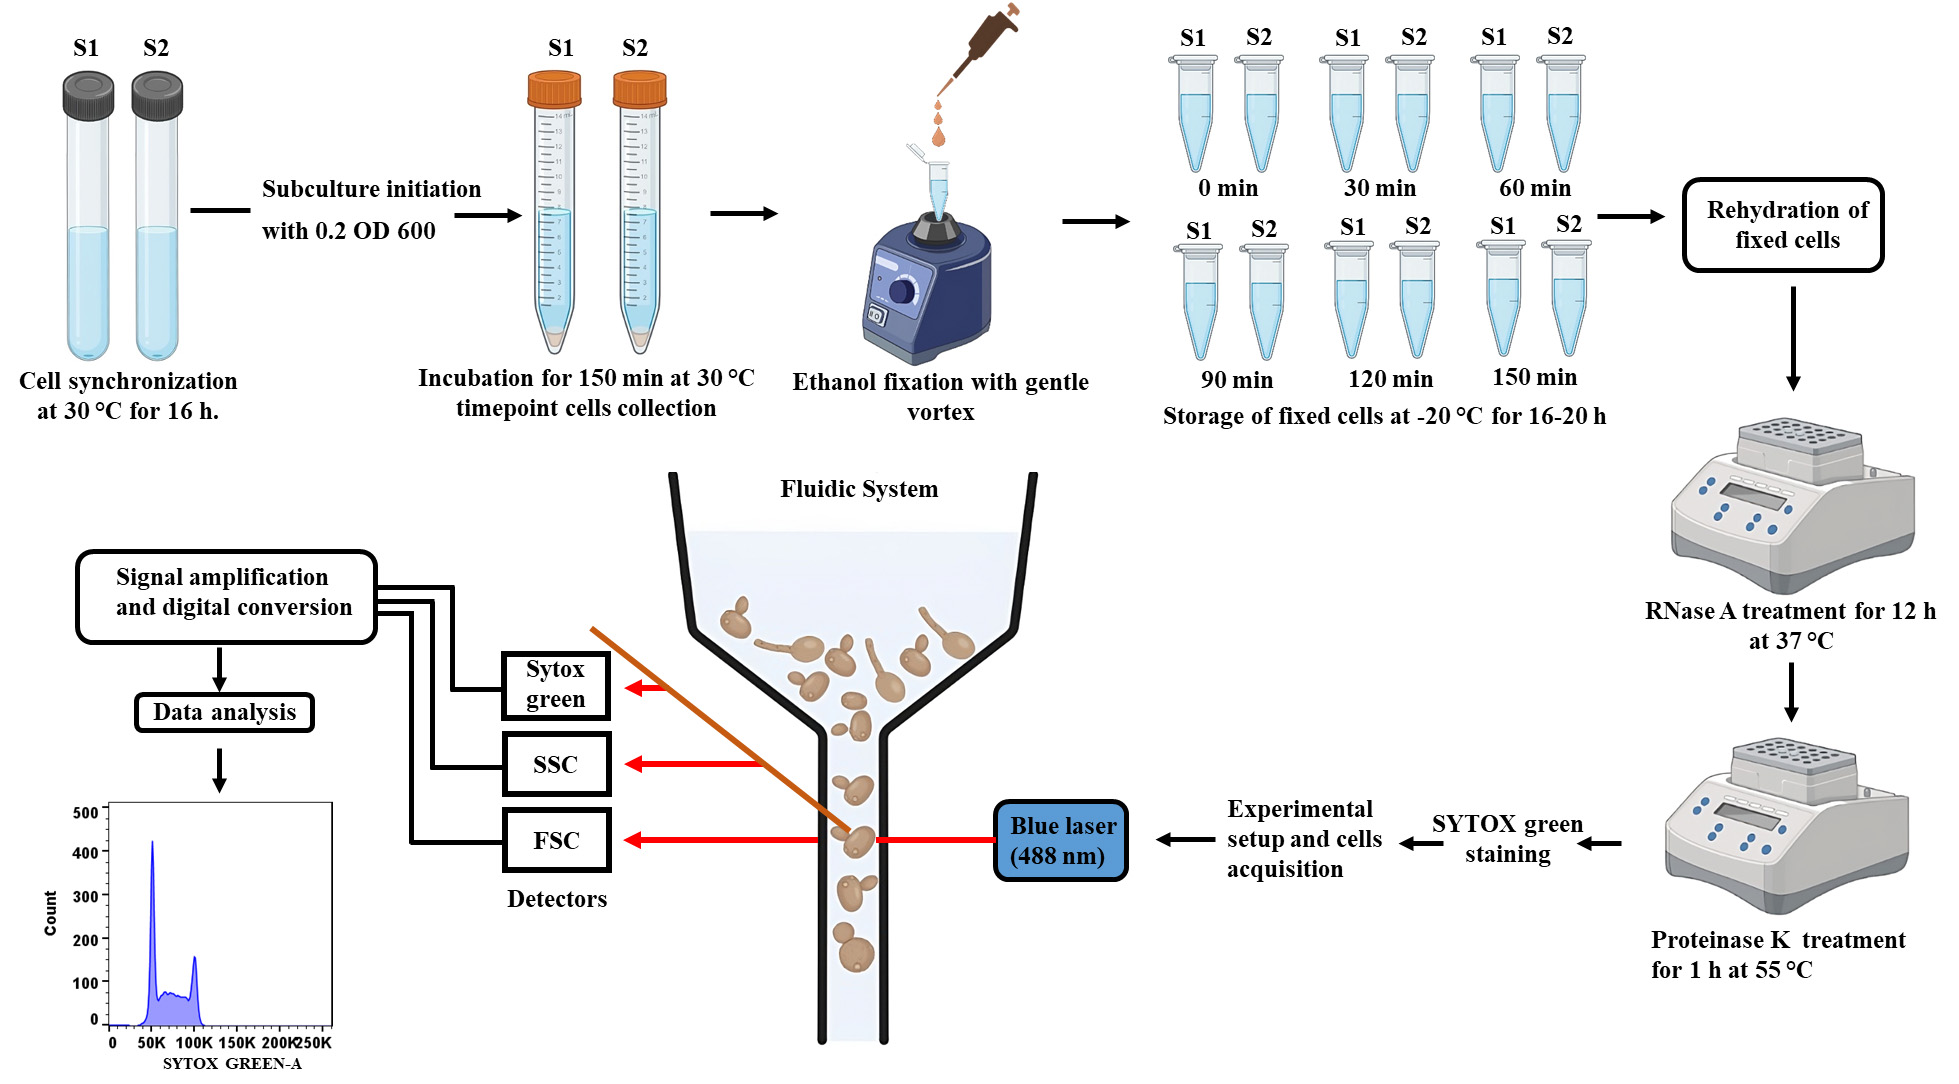
Figure 2. Schematic stepwise demonstration of the cell cycle analysis of C. albicans. Synchronized cells will be allowed to grow for 150 min and will be harvested at every 30 min to monitor cell cycle progression. Cells will be fixed with ethanol, stained with SYTOX green, and analyzed by flow cytometry to complete the cell cycle analysis.
One of the key advantages of using flow cytometry for cell cycle analysis in yeast is its ability to analyze a large number of cells at a single-cell level rapidly. This technique employs a laser-based system to measure the fluorescence emitted upon a fluorochrome (in this case, a nucleic acid staining dye) binding to cellular DNA while cells pass through a flow cell. Different nucleic acid staining dyes including 4′,6-diamidino-2-phenylindole (DAPI), propidium iodide (PI), and 7-amino actinomycin D (7-AAD) have been used by researchers to access the cell cycle based on the cell types to be analyzed, although PI is the preferred one. In S. cerevisiae, PI staining has been proven effective, and the same was initially adopted by us for cell cycle analysis of C. albicans (Manohar et al., 2018). However, a major concern associated with PI is the relatively high coefficient of variation (CV) and low signal amplification rate of PI-stained cells, which limit the accuracy and reproducibility of the cell cycle (Haase and Reed, 2002). To overcome this problem, we now use SYTOX green as it exhibits low CV, high signal amplification with low signal-to-noise ratio, and low photobleaching rate, thus being an ideal fluorochrome for accurate and reproducible DNA content measurement (Thakur et al., 2015; Patel et al., 2023). In summary, this protocol outlines detailed steps involved in the cell cycle analysis of a wild-type strain of C. albicans, SC5314, using SYTOX green with a simple cell synchronization strategy providing the precise measurement of DNA content in each phase of the cell cycle by flow cytometry (Figure 3). By employing this protocol, researchers can gain valuable insights into the cell cycle dynamics, which will be helpful in understanding the diverse physiological processes of C. albicans. The same protocol can be adopted for other fungal species as well.
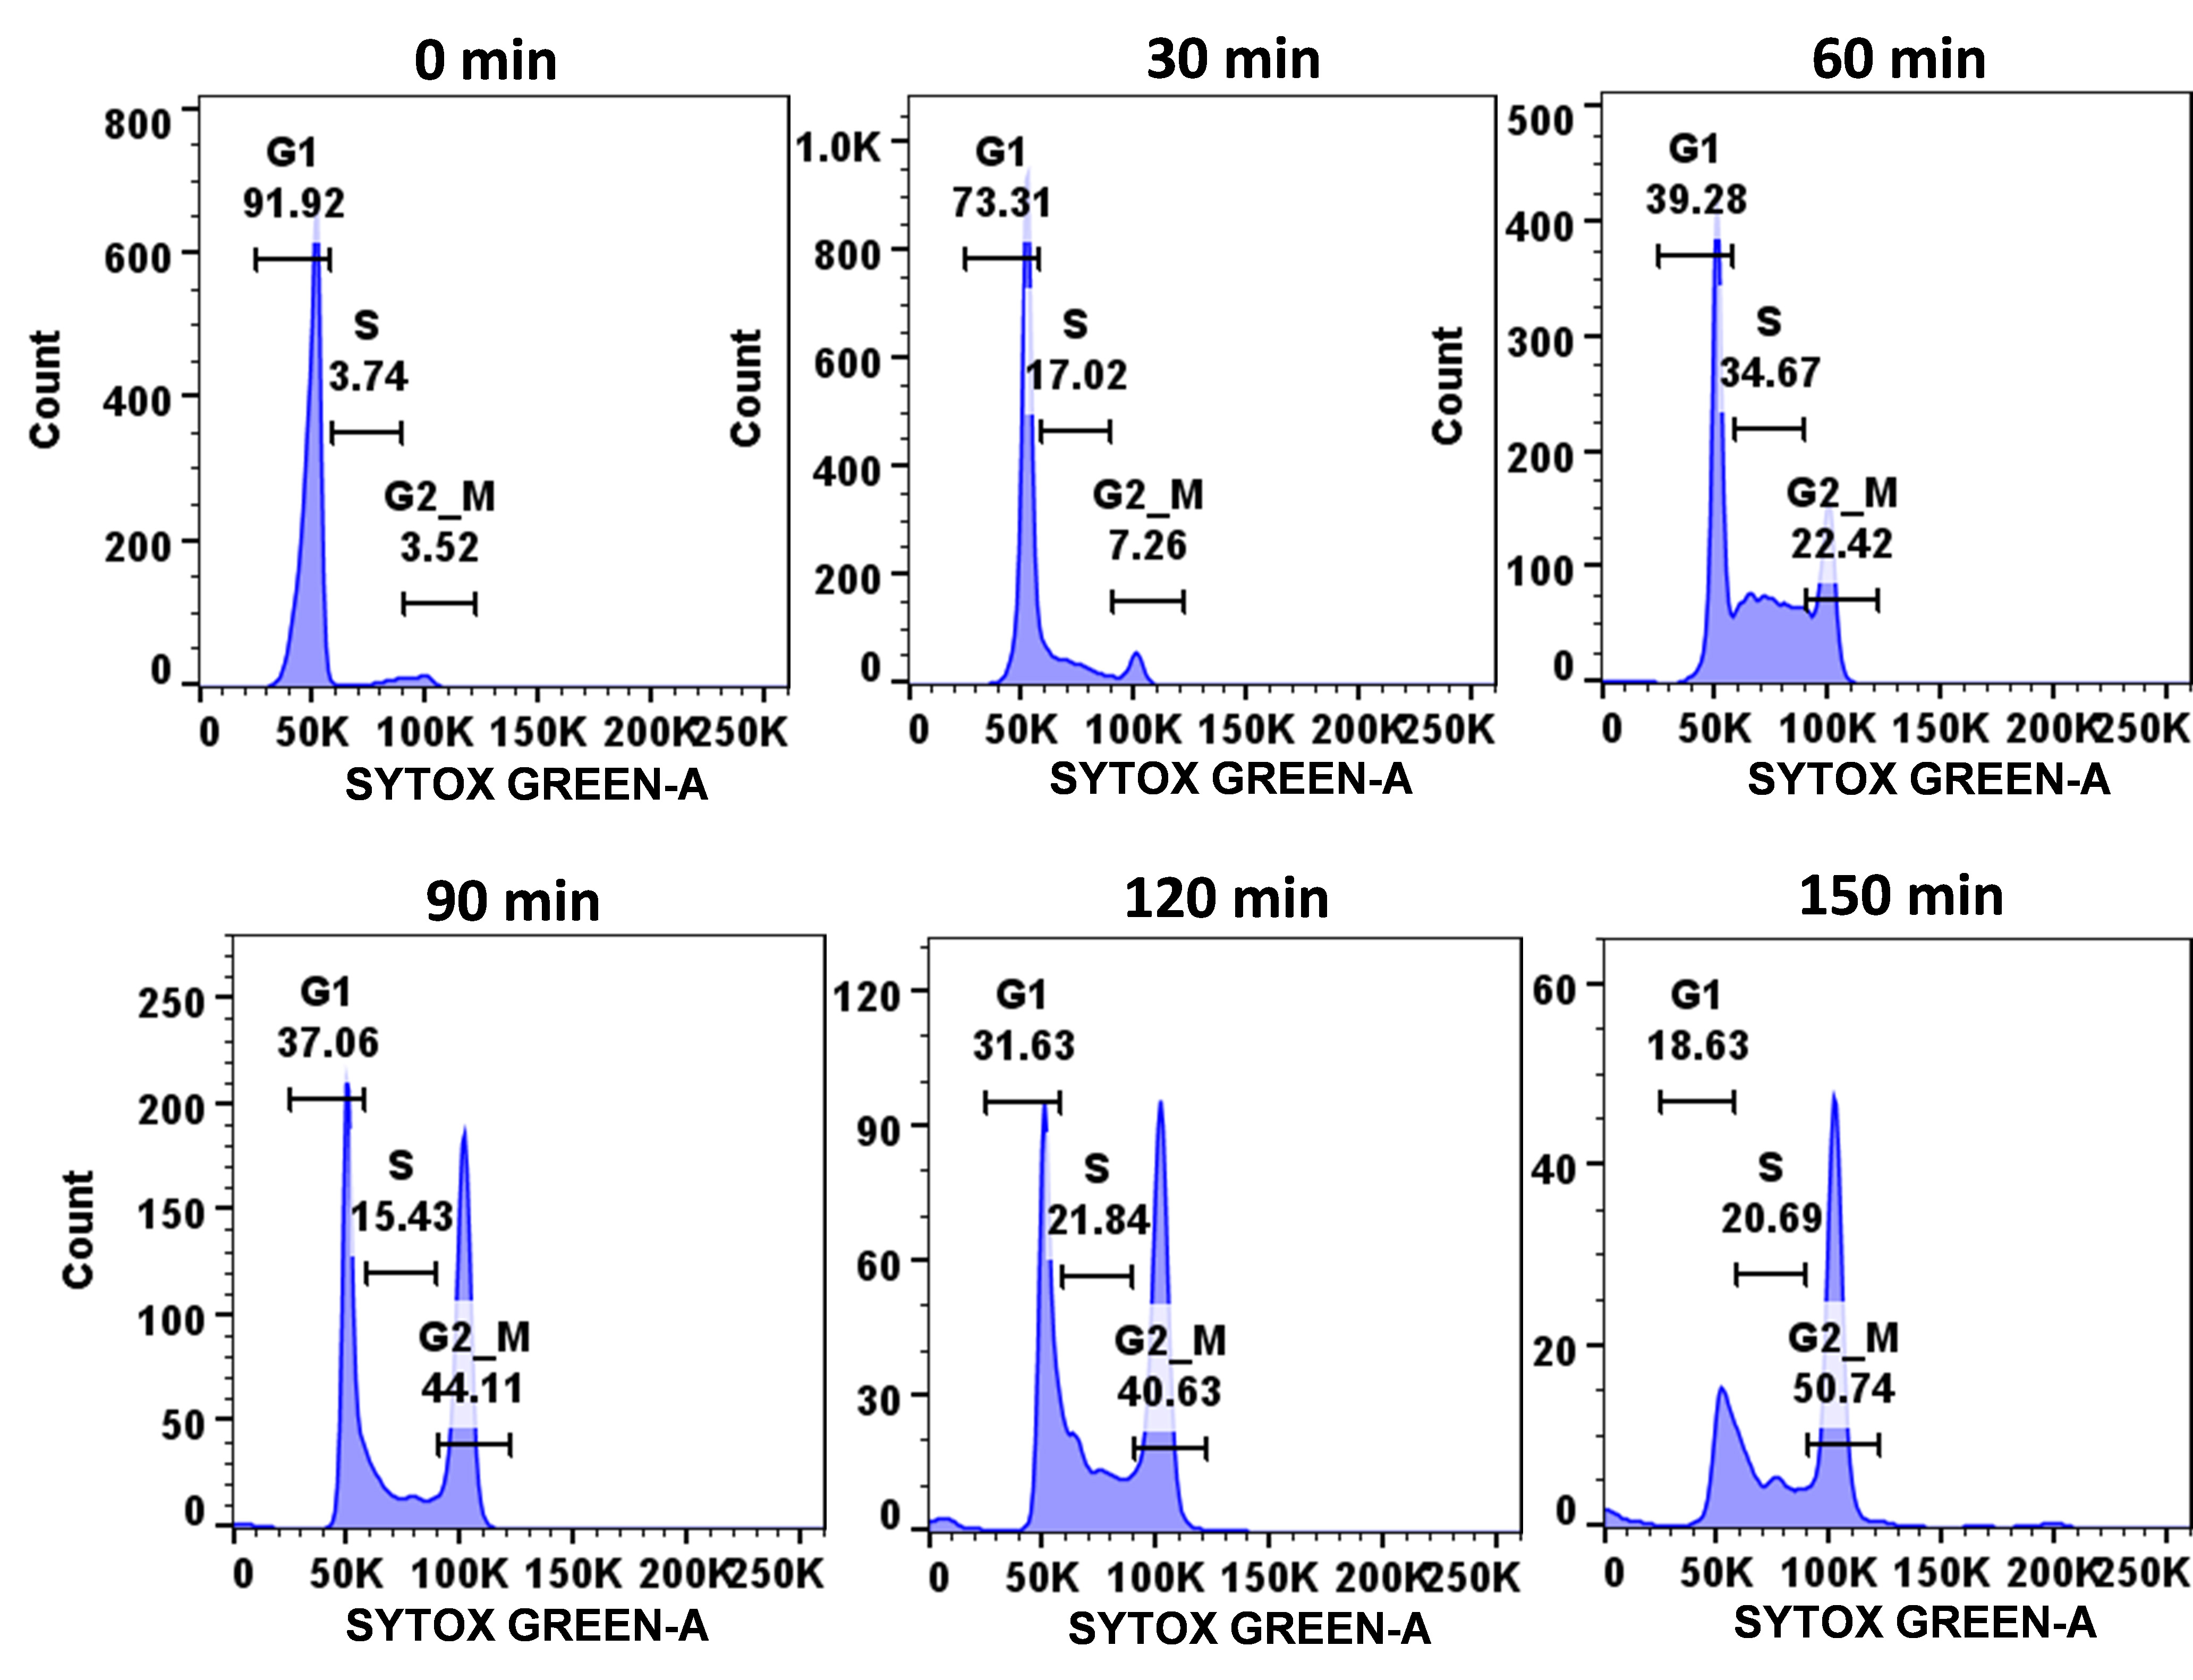
Figure 3. Demonstration of cell cycle progression of wild-type C. albicans cells. Using the described protocol, a synchronized population of C. albicans cells (SC5314 strain) was allowed to progress through the cell cycle and, at mentioned time points (0–1 h), cells were harvested, fixed, stained with SYTOX green, and analyzed by flow cytometry.
Materials and reagents
C. albicans SC5314 or any other strain of interest
Autoclavable round bottom glass culture tubes (Borosil, catalog number: 9900006)
Yeast extract peptone dextrose broth (YPD) (Himedia, catalog number: M1363)
Ethanol (Fisher Chemical, catalog number: 2051537)
Sterile 1.5 mL microcentrifuge tube (Axygen, catalog number: MCT150LC)
FACS tube (Tarson, catalog number: 850010)
Cuvettes (Eppendorf, catalog number: 0030106300)
Proteinase K (Puregene, catalog number: PG-6070)
RNase A (SRL, catalog number: 98915)
Sodium citrate (Mp Biomedical, catalog number: 194817)
SYTOX green (Thermo Fisher Scientific, catalog number: S7020)
Dimethyl sulfoxide (DMSO) (Mp Biomedical, catalog number: 196055)
Acetic acid glacial 99%–100% (Merck, catalog number: CE1C710249)
Tris (Mp Biomedical, catalog number: 194855)
CaCl2 (Sigma-Aldrich, catalog number: C4901-500G)
Glycerol (Himedia, catalog number: MB060-1L)
NaCl (Mp Biomedical, catalog number: 152575)
Solutions
Sodium citrate buffer (see Recipes)
Proteinase K solution (see Recipes)
RNase A solution (see Recipes)
Recipes
Sodium citrate buffer
Reagent Final concentration Quantity Sodium citrate 50 mM 14.7 g H2O n/a Make up the volume Total n/a 1,000 mL Adjust the pH to 7.4 with glacial acetic acid.
Proteinase K solution
Reagent Final concentration Quantity Proteinase K 20 mg/mL 100 mg Tris-HCl (1 M, pH 8.0) 10 mM 50 μL CaCl2 (100 mM) 1 mM 50 μL Glycerol 50% 3.125 mL H2O n/a 1.775 mL Total n/a 5 mL Store the solution in 1 mL aliquots in 1.5 mL microcentrifuge tubes at -20 °C.
RNase A solution
Reagent Final concentration Quantity RNase A 10 mg/mL 200 mg Tris-HCl (1 M, pH 7.5) 10 mM 200 μL NaCl (5 M) 15 mM 60 μL H2O n/a 19.54 mL Total n/a 20 mL Boil the solution at 95 °C for 15 min and allow it to cool slowly at room temperature. Store the solution in 1 mL aliquots in 1.5 mL microcentrifuge tubes at -20 °C.
Equipment
Laminar airflow (Thermo Scientific Biological Safety Cabinets, catalog number: 41346502)
Sterile pipette sets (Gilson, catalog number: F123606-1mL, F123605-200µL, and F123604-20µL)
Spectrophotometer (Eppendorf Bio Photometer plus, catalog number: 6132)
Shaker incubator 30 °C (Scigenic Biotech, catalog number: LE-4676-AA)
Incubator 30 °C (Scigenic Biotech, catalog number: C-1NC-100-1)
Centrifuge (Eppendorf, catalog number: 5810R with SL086 rotor)
Flow cytometer (BD LSRFortessa Cell Analyzer, catalog number: 647177H6)
-20 °C freezer (Vestfrost, catalog number: BFS 345)
Heat block (Eppendorf Thermo Mixer C, catalog number: 5382000023)
Software
BD FACSDiva Software
FlowJo v8.2.0
GraphPad prism v8.0
Procedure
Cell synchronization
Freshly streak C. albicans strain on a sterile YPD agar plate and incubate at 30 °C for 24–36 h. Inoculate an isolated colony in 5 mL of sterile YPD broth and grow at 30 °C in a shaker incubator for 16 h at 200 rpm. This growth condition has been repeatedly found to cause effective spontaneous synchronization of C. albicans cells (> 90% cell synchronization will be achieved). Critical: Always pick a single isolated colony and inoculate it in 5 mL of YPD broth for all the strains to be analyzed.
Dilute the synchronized culture with YPD broth to obtain an OD600 of 0.2 in a total volume of 10 mL and allow them to grow for up to 150 min at 30 °C and 200 rpm for timewise cell collection.
Cell fixation by ethanol
Collect 1 mL of C. albicans every 30 min in a 1.5 mL microcentrifuge tube and centrifuge at 10,621× g for 1 min at room temperature. Remove the supernatant and wash the pellet twice with 1 mL of sterile distilled water. Resuspend the pellet in 1 mL of sterile distilled water and immediately place it on ice to arrest cell progression.
Take 10 μL of culture for cell number counting by using a hemocytometer. Collect approximately 1 × 10⁷ cells from the stock for ethanol fixation. Critical: When working with multiple strains simultaneously, determine the cell number of any one of the strains (not necessary to count the cell number of every strain). Accordingly, dilute all the strains to get the desired cell number for fixation. As the methodology is standardized for a wide range of cell populations (1 × 10⁶–1 × 10⁸ cells), there will be no issue with minor differences in cell populations between different samples.
Resuspend the counted (~1 × 10⁷ cells) cells in 300 μL of sterile distilled water and add 700 μL of 100% cold ethanol dropwise while vortexing. Vortex gently in between the drops. Caution: While adding fixative, vortex slowly to ensure good fixative penetration and reduce cell clumping. As the fixation process is an exothermic reaction and heat liberated could damage the sample, fix the cells with cold ethanol only.
Incubate the ethanol-resuspended cells at -20 °C for 16–20 h. Critical: C. albicans strains with pseudohyphal and hyphal cells need to be incubated for 24 h.
Pause point: After ethanol fixation, cells can be stored for several months at -20 °C by sealing properly with parafilm.
Caution: Cells can only be stored in ethanol as it will make the cells porous, which helps efficient staining by SYTOX green at later stages. Storing in ethanol also prevents microbial growth during long-term storage. Unlike fixed animal cells that can be stored at 4 °C, fungal cells, due to thick cell walls, must be stored at -20 °C for efficient pore formation.
Rehydration of fixed cells
Centrifuge the ethanol-fixed cells at 10,621× g for 2 min at room temperature and pipette out the supernatant carefully without disturbing the pellet. Caution: Cells will form a loose pellet after centrifugation; if the pellet is disrupted during aspiration, repeat centrifugation for 1 min at the same g force. Remove the ethanol completely as ethanol presence will hamper downstream RNase A and Proteinase K enzymatic digestion. One should open the cap of the tube carefully for rehydration as ethanol spillage may erase the sample labeling.
Resuspend the pellet in 1 mL of 50 mM sodium citrate buffer (pH 7.2), mix by vortexing, and incubate for 10 min at room temperature for rehydration. Centrifuge the cells at 10,621× g for 2 min at room temperature and pipette out the supernatant.
Repeat step C2 for complete rehydration and finally resuspend the rehydrated cells in 1 mL of 50 mM sodium citrate buffer (pH 7.4).
RNase A and Proteinase K treatment
Incubate the rehydrated cells in 25 μL of 10 mg/mL RNase A at 37 °C for 12 h for RNA degradation. Critical: Since SYTOX green can bind to both DNA and RNA, make sure that RNase A is active to cause complete digestion of RNA.
After incubation, directly add 25 μL of 20 mg/mL Proteinase K into the samples without centrifugation, vortex briefly, and incubate at 50 °C for 1 h. Critical: Increase the incubation time for an additional hour when working with pseudohyphal and hyphal C. albicans cells. Proteinase K treatment breaks down cellular proteins to produce uniform optical scattering and inactivates nucleases to prevent DNA degradation in the samples.
Centrifuge the enzymatically treated cells at 12,745× g for 1 min at room temperature and carefully remove the supernatant. Resuspend the cells in 500 μL of 50 mM sodium citrate buffer (pH 7.4).
SYTOX green staining
Take 200 μL of SYTOX green from a 5 mM stock and make up the volume to 1 mL with DMSO to make a 1 mM working solution. Add 1 μL of 1 mM SYTOX green working solution to each sample and incubate them at 4 °C for 2 h in the dark. Caution: Prepare the SYTOX green working solution in an amber color microcentrifuge tube, divide the working solution into 100 μL aliquots, and store at -20 °C. Prevent direct light exposure at the time of staining by covering the FACS tubes with aluminum foil during incubation.
Wash the cells with 500 μL of 50 mM sodium citrate buffer (pH 7.4) and transfer it into properly labeled FACS tubes for acquisition. Pause point: Stained cells can be stored overnight for next day acquisition as the SYTOX green is a relatively more stable dye than PI.
Experimental setup and cell acquisition
Perform the routine cleaning of the flow cytometer to avoid contamination and switch on the laser light prior to acquisition. Caution: Before starting the acquisition, fill the sheath tank and empty the discard tank for uninterrupted acquisition. Switch ON the laser 10 min before starting acquisition to stabilize the laser, which is important for efficient excitation of the fluorochrome.
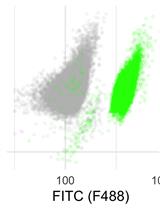
Login to the respective FACS software (BD FACSDiva software), open the workspace, and set up a new experiment. Select the forward-scatter area and height (FSC-A & H) and the side-scatter area and height (SSC-A & H) along with SYTOX green in the Cytometer window and ensure the connectivity status. Critical: SYTOX green is excited by Blue laser (488 nm) with an emission maximum of 523 nm, which is similar to that of fluorescent isothiocyanate (FITC) and Alexa fluor 488; so, one can select FITC or Alexa Fluor 488 if SYTOX green is not listed in the fluorochrome panel of the Cytometer window as cytometer configuration varies from machine to machine.
Set up the dot plot of SSC-A vs. FSC-A to eliminate debris and FSC-H vs. FSC-A to discriminate singlet population, along with the histogram plot SYTOX green-A vs. Count to determine the different stages of the cell cycle in the worksheet window.
Run a test sample at low flow rate to adjust the voltage of all three parameters (FSC, SSC, and SYTOX green) and determine the events per second. Critical: Maintain a low flow rate for all samples throughout the acquisition. Do not change the flow rate to medium or high, and do not acquire samples with different flow rates as that will cause variation in SYTOX green excitation, and the obtained results will be erroneous.
Once the experimental setup and voltage setting are stable, acquire all the samples with 50,000 gated events. After the acquisition, clean the fluidics system according to the user’s manual and switch off the laser. Critical: To avoid cell clumping, place a vortex machine next to the flow cytometer, vortex for a brief period, and then quickly acquire. Maintain 400–500 events/second for all the samples and accordingly dilute the samples with sodium citrate buffer.
Data analysis
Export data of all individual samples in .fcs file format from the FACSDiva software and import into the FlowJo v8.2.0 software for analysis.
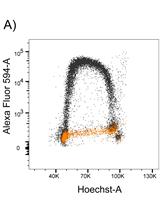
Follow a similar gating strategy as that of the FACSDiva software during acquisition. First, discriminate the debris from the cells by plotting SSC-A vs. FSC-A; then, from the cells, gate the singlet population by plotting FSC-H vs. FSC-A; finally, take singlet cells for cell cycle analysis via histogram plot of SYTOX green-A vs. Count (Figure 4).
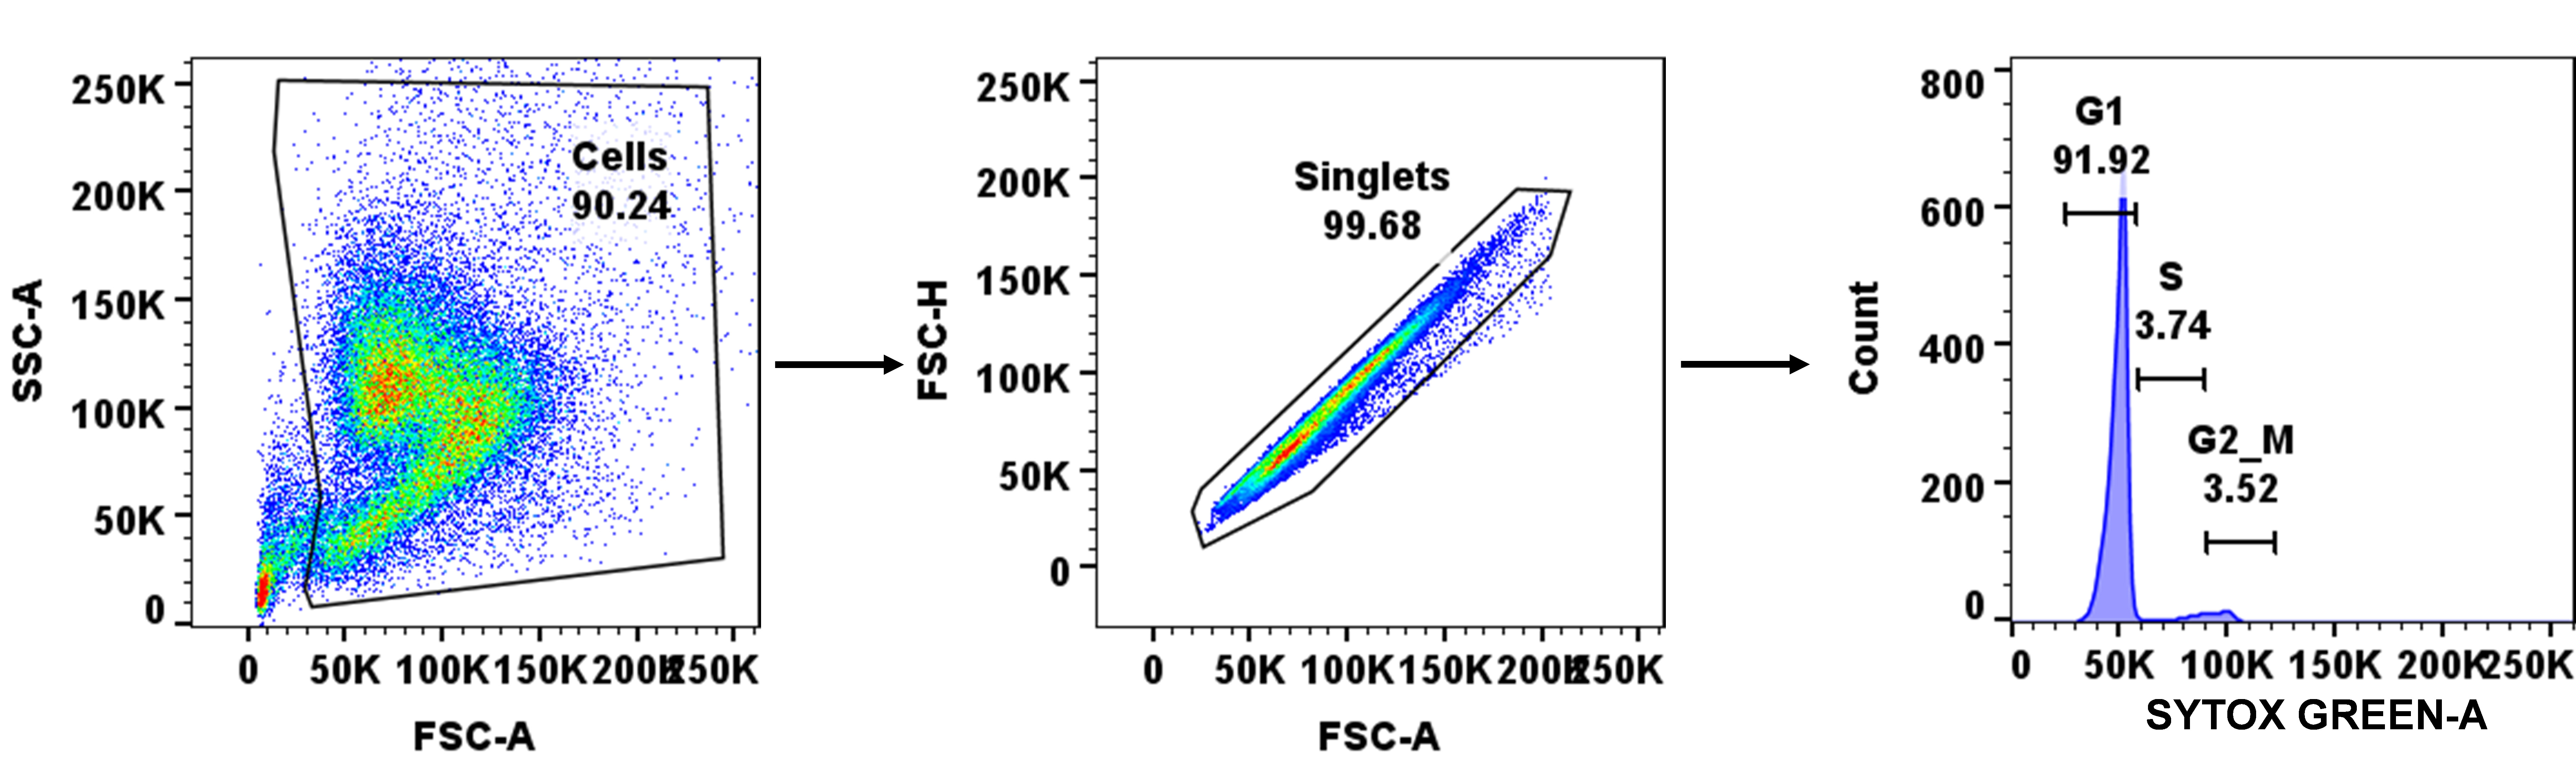
Figure 4. Demonstration of gating strategy during cell cycle analysis using FACSDiva software. Stained cells were shorted for the singlets by forward and side scattering, and then analyzed for SYTOX green staining. At 0 h, most of the cells were found to be synchronized to the G1 phase. For each time point, a similar gating strategy was applied.Create a batch analysis of the histogram plot having all samples in the layout editor with proper labeling of each stage of the cell cycle, and finally export the images into PowerPoint.
Validation of protocol
This protocol or parts of it has been used and validated in the following research article(s):
Patel, SK. et al. (2023). Pol32, an accessory subunit of DNA polymerase delta, plays an essential role in genome stability and pathogenesis of Candida albicans. Gut Microbes (Figure 3, panel d).
Manohar, K. et al. (2018). TLS dependent and independent functions of DNA polymerase eta (Polη/Rad30) from Pathogenic Yeast Candida albicans. Mol. Microbiology (Figure 8).
Notes
When working with fast/slow growing strains of C. albicans, perform a growth curve analysis and compare the growth difference in terms of time with the wild-type strain, and accordingly increase or decrease the time of incubation from 16 h for cell synchronization at 30 °C. For example: if a strain is 30 min slower to reach the stationary phase as compared with the wild-type strain, then incubate that particular strain an additional 30 min for exact synchronization.
RNA digestion is very crucial for cell cycle analysis, as improper digestion leads to indistinct cell stages (absence of prominent G1 and G2 phase). Check for the presence of RNA through fluorescence microscopy; cytosol will give off a bright green fluorescence if RNA is not properly digested, whereas punctate nuclei will be observed with proper RNA digestion without cytosolic fluorescence.
Activity of RNase A and Proteinase K can be checked by setting up digestion with purified RNA and protein, respectively.
Check the optical alignment of the flow cytometer prior to acquisition and perform check-beads run for proper alignment if necessary. Improper alignment may lead to a high CV.
Always keep the XML file with the FCS files while exporting the data from the FACSDiva software, which will help in reimporting the data to the FACSDiva software, if necessary, as an FCS file alone cannot be imported to FACSDiva.
Acknowledgments
This protocol was developed based on previously published results by the authors (Manohar et al., 2018; Patel et al., 2023). This work was supported in part by DBT and SERB grants to NA.
Competing interests
The authors declare no competing interests.
References
Berman, J. (2006). Morphogenesis and cell cycle progression in Candida albicans. Curr. Opin. Microbiol. 9(6): 595–601.
- Haase, S. B. and Reed, S. I. (2002). Improved flow cytometric analysis of the budding yeast cell cycle. Cell Cycle 1(2): 132–136.
- Hartwell, L. H., Culotti, J., Pringle, J. R. and Reid, B. J. (1974). Genetic control of the cell division cycle in yeast. Science 183(4120): 46–51.
- Kumari, P., Sahu, S. R., Utkalaja, B. G., Dutta, A. and Acharya, N. (2023). RAD51–WSS1-dependent genetic pathways are essential for DNA–protein crosslink repair and pathogenesis in Candida albicans. J. Biol. Chem. 299(6): 104728.
- Ma, H. T. and Poon, R. Y. C. (2017). Synchronization of HeLa Cells. Methods Mol. Biol. 1524: 189–201.
- Manohar, K., Peroumal, D. and Acharya, N. (2018). TLS dependent and independent functions of DNA polymerase eta (Polη/Rad30) from Pathogenic Yeast Candida albicans. Mol. Microbiol. 110(5): 707–727.
- Patel, S. K., Sahu, S. R., Utkalaja, B. G., Bose, S. and Acharya, N. (2023). Pol32, an accessory subunit of DNA polymerase delta, plays an essential role in genome stability and pathogenesis of Candida albicans. Gut Microbes 15(1): e2163840.
- Rosebrock, A. P. (2017). Methods for Synchronization and Analysis of the Budding Yeast Cell Cycle. Cold Spring Harb. Protoc. 2017(1): pdb.top080630.
- Thakur, S., Cattoni, D. I. and Nöllmann, M. (2015). The fluorescence properties and binding mechanism of SYTOX green, a bright, low photo-damage DNA intercalating agent. Eur. Biophys. J. 44(5): 337–348.
Supplementary information
The following supporting information can be downloaded here:
- Figure S1. Cellular morphology of wild-type C. albicans cells before and after synchronization without and with staining with SYTOX green
Article Information
Publication history
Published: Oct 20, 2023
Copyright
© 2023 The Author(s); This is an open access article under the CC BY-NC license (https://creativecommons.org/licenses/by-nc/4.0/).
How to cite
Patel, S. K., Sahu, S. R. and Acharya, N. (2023). Cell Cycle Analysis of Candida albicans by Flow Cytometry. Bio-protocol 13(20): e4848. DOI: 10.21769/BioProtoc.4848.
Category
Microbiology > Microbial cell biology
Cell Biology > Cell-based analysis > Flow cytometry
Do you have any questions about this protocol?
Post your question to gather feedback from the community. We will also invite the authors of this article to respond.
![]() Tips for asking effective questions
Tips for asking effective questions
+ Description
Write a detailed description. Include all information that will help others answer your question including experimental processes, conditions, and relevant images.